


A support ticket flags a billing complaint. A churn-risk comment sits inside an NPS response three weeks old. A one-star review names a feature gap your product team hasn't heard of yet. None of it gets read in time to matter. The problem was never reading it. It's the sheer volume it actually arrives in.
That's the gap the best text analysis software closes, turning that pile into something a CX lead, product manager, or research team can act on the same week it lands, not the same quarter. And, it's a common limitation. McKinsey research found only 15% of leaders consistently incorporate customer input into their decisions, meaning most companies gather feedback they never really use. It's not that teams don't care; their tools were never built to handle feedback at today's volume and variety.
Whether you're a CX lead, a product manager or part of a research team, the real question isn't whether to analyze your feedback — it's which tool fits how your team works. That's what I set out to answer, comparing 20+ tools to find the 10 best text analysis software.
I evaluated Google Cloud Natural Language API, SAS Viya, Chattermill, Canvs, Caplena, Dovetail, Speak, Amazon Comprehend, Kimola, and ATLAS.ti on model accuracy, setup time for non-technical users, integration depth, multilingual support, and output usability for non-specialist stakeholders.
In this guide, you'll know the tools teams actually use from ones that add another dashboard nobody opens. What follows is the shortlist that held up.
* These text analysis software are top-rated in their category based on G2's Spring 2026 Grid Report and market reputation. I've included their strengths and ideal use cases to help you choose the right solution for your team.
Picking the right platform comes down to three things: where your feedback actually lives, how much your team can handle analytically without extra support, and whether the tool's output is usable by the people who need to act on it.
More platforms now claim enterprise-grade text analysis than ever before, with overlapping feature sets and similar positioning. G2 currently lists 191 products in the Text Analysis Software category alone — spanning everything from API-first NLP tools to full-stack feedback platforms, all competing for the same enterprise budget. What actually separates them is model accuracy on real-world language, integration reliability, and usability of the output. The hard part for a buyer isn't finding a tool. It's telling the genuinely capable ones from the others.
The selected platforms integrate directly with survey tools, CRM systems, and support platforms to pull live feedback into your analysis workflow and automate theme clustering across large datasets into dashboards a non-technical stakeholders can read without a data science briefing. The ten tools that I shortlisted based on my evaluation of G2 reviews earn their spot based on these criteria, and not just features.
What you actually get from a well-configured platform is confidence. Less time between data collection and insight, analysis grounded in what customers said. And a foundation for decisions that would otherwise rest on assumptions.
I started with G2's Spring 2026 Grid Report to shortlist platforms based on verified user satisfaction scores and market presence, covering small research teams, mid-market CX functions, and enterprise data operations.
From there, I ran AI-assisted analysis across hundreds of verified G2 reviews to identify what separates good from mediocre in real workflows: model accuracy on domain-specific language, theme clustering quality, multilingual support, integration reliability, setup time for non-technical users, and output usability for stakeholders who aren't data specialists.
To be transparent, I haven't personally deployed every platform on this list in a live environment. So I pressure-tested my findings with practitioners in CX, UX research, and data teams who use these tools day to day.
Product visuals and references are sourced from G2 vendor listings and publicly available documentation.
I pulled these five criteria from patterns in G2 reviews that helped me understand what reviewers consistently praise, and what makes them give up on a text analysis tool. Here's what I found:
Not every platform on this list excels equally across all the above-mentioned criteria. Some are stronger on model accuracy and integration depth, others are stronger on qualitative research support or output usability. My approach was to match each platform's G2 review-based strengths to the team profiles they serve best. Choose based on your specific analytical gap, your team's technical capacity, and the data volume you manage today and plan to manage tomorrow.
To appear in this category, a platform must:
This data was pulled from G2 in 2026. Some G2 reviews may have been edited for clarity.
Google Cloud Natural Language API simplifies NLP, and that's what makes it worth talking about. Named entity recognition, sentiment analysis, keyphrase extraction, syntax parsing, and content classification all run through REST endpoints with no model training needed. Your developers get production-grade NLP into a pipeline in days. For teams already using Google Cloud Platform (GCP), it plugs i straight into existing pipelines, no custom model required. Healthcare, finance, media, and e-commerce all run on it, from document categorization to chatbot automation at scale.
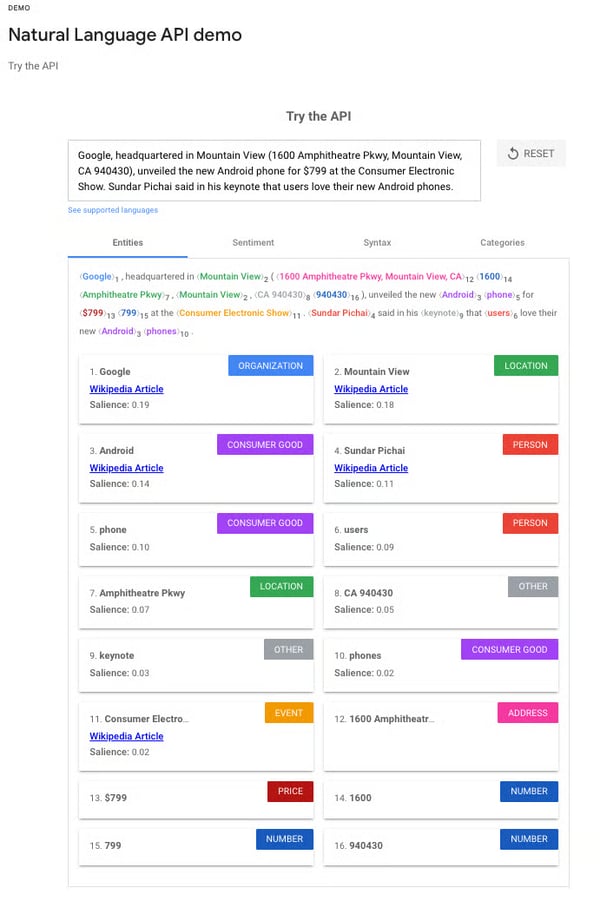
Standing at 92% feature rating in G2 Data, named entity recognition is where this API stays reliable under real production load, staying accurate as input formats shift. This enables your team to pull transaction details from financial documents, extract medical entities from OCR output, and structure large volumes of customer text, without the accuracy wobbling between domains.
Sentiment classification is one capability I kept coming back to in the review data. CX teams, social media analysts, and support operations all rely on it heavily for everything from ticket routing to analyzing open-ended survey responses at scale. Topic analysis is another common use case, and both capabilities hold up well as data volumes grow.
Keyphrase extraction slots into content tagging, search indexing, and research pipelines, where it's important to quickly pull signals from unstructured text. With 91% rating in G2 Data, this feature reduces manual tagging effort for your team sitting on large text volumes, without needing a custom model running behind it. The performance stays consistent with the API's broader NLP range across automated content workflows.
AutoML integration is where this API extends beyond standard NLP tooling. Teams build and deploy custom classifiers within the same GCP environment, eliminating the need for separate training infrastructure. Connections to Cloud Storage, Vertex AI, and GCP orchestration layers work without additional complexity. G2 Data's integration scores at 87%, and the cross-service consistency makes this feel like a real ecosystem.
After thorough analysis of G2 reviews, I say that the documentation helps developers working on integrations fast without requiring a deep ML background. Quickstart guides, inline code examples, and active community forums do the heavy lifting. An ease-of-use score of 90% reflects what reviewers consistently report: low ramp-up time that cuts onboarding costs and keeps teams focused on building, with less time lost to setup troubleshooting.
G2 Data's language identification scores stand at 91%, and looking across the review data, I can say that number tells a real story. Multilingual coverage spans regional Indian languages, global customer feedback pipelines, and non-English social media monitoring. For your teams operating across geographic markets, this removes the need to maintain separate models per language,and the time saved compounds as more markets get added.
G2 reviewers note a defined ceiling when workflows require domain-specific tuning. Users report limited ability to fine-tune outputs beyond the default classifiers, and some flag a missing data model as a gap when requirements move beyond general-purpose text processing. That said, standard sentiment, entity, and keyphrase tasks run comfortably within the API's range, and the pre-trained model coverage continues to expand with each platform update. For teams whose needs sit within that range, this ceiling shouldn't be a practical constraint.
Per-unit pricing works at development volumes, but G2 reviewers note costs compound as data scale and inference frequency increase. Teams without existing GCP committed spend feel this more acutely at production scale. However, the tiered pricing structure makes the cost progression visible ahead of each step-up, giving teams a clear picture of spend before committing to higher volumes.
Google Cloud Natural Language API is the go-to for developer teams that need production-grade NLP inside a cloud-native workflow. Named entity recognition, sentiment analysis, and multilingual support hit the top of the category. Based on my evaluation, the GCP ecosystem integration is what seals it, removing the friction that standalone tools drag in. Teams whose requirements sit within the pre-trained model range will find this one delivers consistently.
"Google Cloud is the best in everything, like I used the natural language API to help healthcare services. Its best feature is that it allows users to upload their databases and big files. And give all the good decisions for any database."
- Google Cloud Natural Language API review, CA Dishi T.
"For businesses, this tool becomes costly. However, it has a free tier at the beginning, but in the later stage it will become costly, which is the only concern, and another thing is that we can find only limited documentation for custom models, so this makes life a little harder in this case."
- Google Cloud Natural Language API review, Sumanth S.
Hitting the ceiling on pre-trained models? The best machine learning tools for 2026 cover platforms built for teams that need custom model training and domain-specific NLP beyond what APIs like this one offer out of the box.
SAS Viya is the platform enterprise teams reach for when point solutions stop scaling. From what I've seen across the reviews, the tool stands out most for how much it brings together in one place. Data preparation, text analysis, machine learning, model deployment, and visual reporting run inside one cloud-native environment that natively supports SAS, Python, R, and REST APIs. Financial services, public sector, and manufacturing teams use it to process population-scale datasets and close the loop from raw data to production without switching tools.
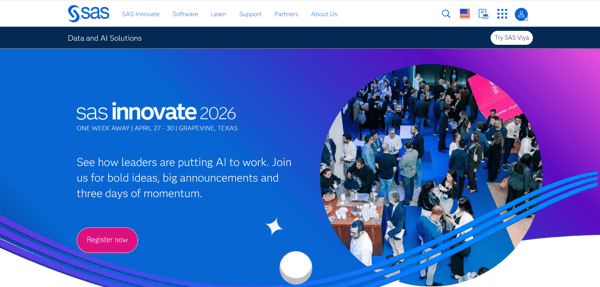
For your team moving from raw data to presentation-ready visuals, SAS Visual Analytics handles it all in one place without jumping between tools, closing the gap between analysis and the decisions it actually drives. That consistency spans industries, and a data visualization score of 88% in G2 Data's feature ratings, the highest across the entire feature set, backs up exactly what teams keep describing day to day.
Cloud-based distributed processing lets teams run population-scale analytics, factory sensor pipelines, and high-volume financial models without sampling or reducing datasets. Performance stays stable as data increases. G2 reviewers rate automation at 86%, and what stuck with me was how often that translates to end-to-end scoring and batch deployment pipelines that cut a team's reliance on separate engineering resources.
Based on my scouring of the tool's G2 reviews, the deployment range is broad. Job Scheduler, MAS, and real-time streaming via ESP give teams flexibility to push model outputs into live applications or handle large batch workloads on schedule. Teams mention this workflow coverage, from model training through to live deployment, as what separates SAS Viya from tools that stop at analysis and leave the last mile incomplete.
Built-in access controls, audit trails, and versioning remove a compliance layer that standalone analytics tools require custom tooling to address. Teams meet GDPR requirements while maintaining full traceability across models and data. Regulated industry teams across financial services, public sector, and manufacturing consistently cite security as a primary reason for choosing SAS Viya, a pattern that an 85% security feature rating reflects directly.
Python, R, and REST APIs connect natively, so your data scientists keep existing workflows without retraining on proprietary syntax. Teams embed SAS Viya into ML pipelines spanning Snowflake, Hadoop, and multiple cloud providers without custom connectors. The tool's G2 Data shows integration feature rated at 80%.
Text analytics built into the platform handles keyword extraction, sentiment analysis, and term mapping across large unstructured datasets without external NLP tooling. Teams apply it to customer feedback, fraud detection, and entity resolution in public-sector work. I kept hitting the no-code interface in the review data, scoring 83%, and it makes these capabilities accessible to analysts who would otherwise be completely shut out of the analysis.
G2 reviewers flag initial setup as a meaningful commitment. Kubernetes-based deployment, cloud infrastructure configuration, and integration with existing data systems require technical expertise to complete correctly. Teams without dedicated platform engineering consistently mention needing external support to get through it. Once the configuration is complete, stability and performance are described as strong across the board.
Licensing costs surface across G2 reviews as a material factor, particularly for mid-market and smaller organizations. The pricing model is complex, and the total cost of ownership extends well beyond the license fee to infrastructure and ongoing maintenance. For organizations where analytics, modeling, governance, and deployment need to operate within a single governed environment, the investment maps directly to what SAS Viya removes from the stack — separate tooling, fragmented pipelines, and compliance overhead that compounds at scale.
The way I see it in G2 reviewers' comments, SAS Viya saves organizations real time and engineering effort by keeping analytics, modeling, governance, and deployment inside one governed environment. Automation depth, visualization quality, and open-source integration give data science teams the range to move from raw data to production without changing platforms. This one consistently delivers for organizations where compliance and governance are non-negotiable.
"I appreciate how SAS Viya provides an easy-to-use platform with a drag-and-drop feature that requires no coding, making it accessible for non-techies to engage in machine learning and AI tasks. The ease of setting it up with just a university email is commendable, allowing me to dive right into creating models and performing text analytics efficiently. The software bridges the gap between non-coders and coders by enabling model building and text processing without needing to write code. I find the feature that automatically identifies the best model with the highest ROC after a simulation particularly useful. This, coupled with its efficient text parsing capabilities, makes SAS Viya an invaluable tool for my work. Its efficiency saves time, and the connectivity it offers enhances my data mining and analytics experience."
- SAS Viya review, Zeeshan Azeem K.
"It's just that there are some codes that require more rules, and they are not specified in the description pages. It would be nice if the examples could be expanded."
- SAS Viya review, YOOJUNG P.
Text analysis only works on the feedback you actually capture. The top social media listening tools help teams pull in the unstructured data that never makes it into a survey.
Chattermill is built for feedback operations running across multiple disconnected channels at once. App Store reviews, NPS surveys, support tickets, and social channels all arriving at once with nothing connecting them. The platform ingests all of it, runs AI-driven sentiment and theme analysis across every source, and returns a unified view that updates in real time. Retail, fintech, travel, and SaaS teams use it to replace workflows that previously consumed entire analyst's weeks every month.
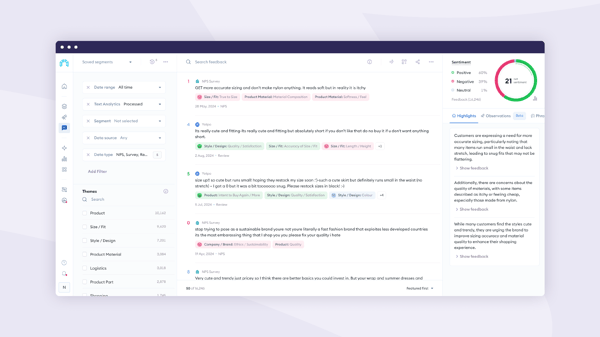
Pulling App Store reviews, NPS responses, CSAT data, and support transcripts into one unified taxonomy makes cross-channel analysis more reliable. I'd point to what G2 reviewers were impressed by: going from ten disconnected systems to a single unified view, with no manual reconciliation required. Sentiment analysis backs that up, scoring 89% in G2 Data, the strongest result across Chattermill's full feature range.
Non-technical stakeholders across product, operations, and marketing teams can access self-serve dashboards directly, without routing requests through the insights team to get the data they need. Filtering, slicing, and reporting are accessible to anyone with a login. A no-code score of 89% reflects what teams frequently report about onboarding colleagues across functions fast enough to make feedback review standard practice organization-wide.
Custom dashboards and theme taxonomies let teams track sentiment shifts after product releases, monitor onboarding friction by market, and measure whether specific pain points improve after interventions. Chattermill ties those theme-level findings directly to retention, revenue impact, and support volume metrics, making the output actionable for your product and operations teams. Data visualization sits at 89% according to G2 Data, tied with sentiment analysis and no-code accessibility as the platform's three highest-rated features.
For organizations running feedback across multiple countries, translation and sentiment classification eliminate the need for separate regional analysis workflows running in parallel. Language identification scores 87% in G2's feature ratings, and what stood out to me is that it holds steady across non-English sources too, a more convincing claim than the vague "multilingual support" most tools advertise.
Automated reporting and Slack integration push feedback signals to the right teams without manual report pulling. Engineering and support channels receive alerts on emerging complaints as they surface, closing the loop between customer feedback and the people who resolve it. User reviews describe this as the feature that turns Chattermill from an analysis tool into an early-warning system.
What you get here is support that actually shapes how the platform performs for your organization. My analysis showed that Chattermill's team helps configure themes and taxonomies to match how each organization works, and implementation is described as hands-on and tailored throughout. Quality of support scores 94% in G2 Data, and the reviews back that up by highlighting the tool as one of the stronger support models.
G2 reviewers note that AI-generated categorizations and summaries occasionally require a human check before reaching stakeholders, particularly when feedback is ambiguous or unevenly distributed across themes. This is relevant for teams producing executive-level reporting where outputs go out without an additional review layer. Though, according to G2 reviews, for most of the standard CX and product workflows, the output lands clean enough to use directly. The underlying feedback ingestion and theme structure remain reliable throughout.
I found several reviewers highlighting that export and report customization have defined limits outside standard dashboard workflows. Moving data into formats ready for external tools takes more manual steps than expected, and modifying prebuilt chart layouts has limits for teams with specific reporting needs. If your reporting needs are within the platform's native output, this wouldn't come up as a friction point, as the core analytics and dashboard layer covers the large majority of CX and product use cases reliably.
Chattermill helps teams bring all customer feedback into one place, automatically analyze it, and share insights across the business, without manual work. Sentiment analysis, no-code accessibility, multilingual coverage, and a support model that stays involved are what make it stick. From what I've seen, the teams that get the most out of it are the ones where feedback volume has grown too large to process manually, and the impact shows up quickly once the platform is running.
"It finally gives us a proper, unified view of what members are saying, without having to dig through ten different systems. The dashboards are great for spotting trends fast, and I love how we can slice things by themes like onboarding or matching to see what's actually driving sentiment. It's also been a genuinely collaborative partnership — their team's been proactive in helping us tailor it to how we work and link insights directly to business outcomes."
- Chattermill review, Jamie M.
"Lack of report personalization can sometimes be an issue: even though the tool is easy to use and does report fast, periodically, when you want to modify some aspects of the preestablished graphs."
- Chattermill review, Juan H.
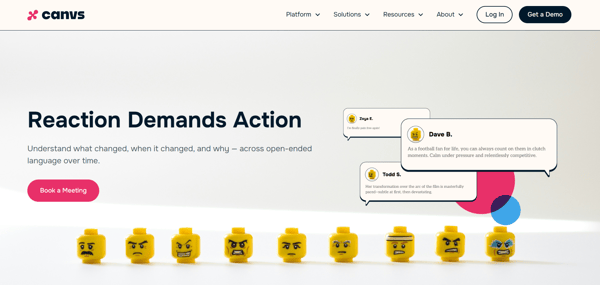
Canvs is where market researchers, insights teams, and media analysts land when open-ended survey responses, social verbatims, and audience comments need to be coded, themed, and summarised without manual work. The platform processes thousands of verbatims in minutes, automatically assigning themes and emotional codes across an entire dataset, covering survey research and social listening in one environment.
Once coding is done, the workflow moves straight into delivery. AI Story Assist generates narrative summaries the moment data is uploaded, letting teams present topline findings to clients the same day a survey closes. G2 reviewers describe querying datasets conversationally and receiving summaries with supporting verbatims in response.
The tool's AI Story Assist generates narrative summaries the moment data is uploaded, letting teams deliver topline insights to clients when a survey closes. G2 reviewers mention querying datasets conversationally and receiving summaries with supporting verbatims in response, turning what previously consumed entire project days into a task that takes minutes. The gap between data landing and insight delivery has effectively closed for teams running this feature at scale.
Custom boolean rules give research teams direct control over how verbatims get categorized, overriding or supplementing AI-generated codes to match existing coding frameworks. Canvs scores 76% for custom extension in G2's feature rating, reflecting how confidently teams trust the output to match their own framework. For teams running monthly or quarterly trackers, that logic carries forward across each new wave automatically, meaning the coding framework built for wave one keeps doing the work in wave ten. That consistency is what lets teams send outputs directly to clients without an additional review layer.
Emotional and sentiment analysis across social verbatims, app reviews, and survey responses accounting for entertainment-specific slang, emoji behavior, and informal language that general-purpose social listening tools miss. Media and broadcast teams describe more accurate classifications of how audiences react to content, talent, and campaigns, particularly where standard tools flatten nuanced responses into simple positive and negative. Its 83% sentiment analysis score on G2 reflects what media teams say wins them over: it doesn't just label feedback positive or negative, it captures the specific emotion behind it.
Tree maps, filtered views, and exportable pivot tables give teams flexible ways to present findings depending on the audience. Your stakeholders get visual presentations while your analysts work from raw data, all without leaving the platform. With an 82% score in data visualization, the tool covers the core presentation needs of most research workflows, and sharing filtered views directly with clients removes a reporting step that would otherwise require entirely separate tooling.
Responsive account management is a recurring theme across recent reviews, with CSMs described as hands-on during onboarding, available for tight-turnaround projects, and proactive in translating client requirements into platform configuration. What stands out in the review data is that post-sale engagement level is a reason teams actively expand their use after initial deployment. The tool's quality of support score of 93% in G2 Data reflects that. For research teams running time-sensitive client work, that level of vendor responsiveness changes what's operationally possible.
G2 user reviews mention that automated coding has a defined boundary when verbatims are short, ambiguous, or tied to a highly specific coding framework. I noticed several reviewers saying that some responses are going uncoded or being categorized in ways that require manual correction before client delivery. Teams with established frameworks from previous tools notice this boundary clearly in early deployment. Accuracy improves steadily as the platform processes more data within each project's coding structure.
Non-English language support operates within a scope that G2 reviewers flag for global research programs. Analysis performs most accurately on English-language verbatim, and translation-dependent workflows introduce precision trade-offs that teams running multilingual trackers. For English users, the primary research programs are unaffected, and Canvs is actively developing language coverage. The platform's core automation, summarization, and emotional classification capabilities operate at full strength within the English-language datasets.
Canvs is a focused platform for insights and research teams that need open-ended analysis to be fast, accurate, and presentable without manual overhead. Automation depth, AI summarization, and account support that stays involved are what make it stick. As I read it, teams that move to Canvs don't just work faster, they take on more open-ended work than they could realistically handle before.
"Before Canvs, I was spending weeks, tagging and theming open-ended comments, trying to tell a story of what guests are saying about our brand. I am now able to tell that same story, with more emotional analysis in just days."
- Canvs review, Maggie G.
"Canvs has a lot of room to grow in terms of its coding of individual open ends. Aside from the actual codes themselves sometimes not making sense and being mis-coded, Canvs often incorrectly tags emotions. For our use case in particular, I wish there was a way to upload all of my previous open ends and how we've tagged them using our previous code frame so that Canvs can learn..."
- Canvs review, Jenna G.
Caplena is where market research agencies and CX teams land when open-ended survey responses need to be categorized, sentiment-tagged, and visualized without having to build that infrastructure from scratch.
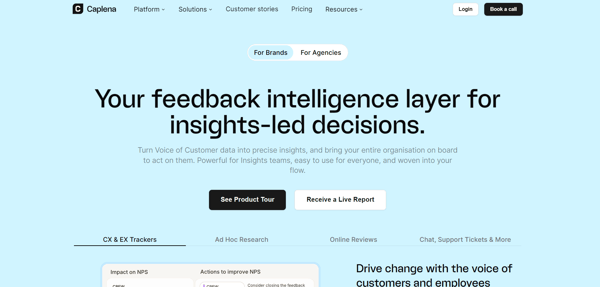
Your team gets AI-driven topic detection combined with a human-in-the-loop coding workflow, processing thousands of verbatims quickly while maintaining the precision required by client-facing analysis. It was good to see reviewers appreciate the tool for offering multilingual support, shareable dashboards, and anonymization functions inside one practical package for teams handling sensitive data across multiple markets.
The platform detects sentiment at the topic level, and this is where it gets interesting for me. Users mention this as particularly useful when a single comment contains mixed feedback, where response-level classification would flatten the nuance that client analysis actually depends on. This is backed by the 91% score of the topic analysis feature in G2 Data.
Research agencies running global programs upload mixed-language datasets and receive consistent topic and sentiment classification across them, without routing non-English responses to separate tools. G2 reviewers scored language identification at 89%. After scouring so many reviews, I can say that operational continuity across markets is where the real value lies. Teams stop managing parallel workflows and start running everything through one consistent pass.
The UX of client-facing reports is consistently praised across reviews. Your stakeholders stop waiting for static reports the moment a shareable dashboard link goes out. Clients filter, drill down, and explore findings independently, and the verbatim-level detail sitting behind each theme is what makes those dashboards credible.
Anonymization and data privacy handling are integrated into the analysis workflow, removing a step that would otherwise add time and tooling to every project. Something that stood out for me in the G2 data was how consistently agencies cite this as what allows them to move client data through analysis without separate compliance tooling. Security lands at 94% on G2, the highest in Caplena's entire feature set, and teams operating under GDPR and data privacy regulations cite it as a deciding factor.
The platform's AI learns from prior coding decisions, improving classification accuracy across the same project. A 92% ease of setup score shows how quickly the learning loop becomes useful in practice. Teams running monthly or quarterly trackers report that outputs are getting measurably closer to their coding logic over time, reducing the manual correction burden that recurring research programs typically carry. The iterative model compounds in value the longer a team runs it.
Support quality starys praiseworthy across plan levels, which isn't something you see often. Where most tools front-load attention during onboarding and pull back after go-live, Caplena's team stays involved: live chat responses are fast and substantive, and user feedback visibly feeds into product updates. Quality of support scores 93% in G2 Data, encouraging teams to expand their use of the platform because the post-sale relationship earns it, not just because the software does.
G2 reviewers note that initial code generation starts broad and requires manual refinement before it meets the specificity that client-facing analysis demands. The AI performs well once a code frame is established. Teams reusing frames from past projects skip most of that setup, with the drag-and-drop editor making refinement fast from there.
G2 reviewers note that chart and dashboard customization have limits for teams with precise formatting requirements. Modifying visual elements beyond the default setting takes multiple steps, particularly for presentations where layout and color matter. Teams whose primary output is exploratory analysis and stakeholder dashboards encounter this less often. The core topic detection and sentiment classification perform reliably, and visualization options continue to expand with each platform update.
Caplena is a strong fit for research agencies and CX teams needing fast, accurate open-ended analysis with the compliance and multilingual coverage to operate across markets. Topic detection, iterative learning, and client-ready dashboards hold up as the project scales. This one stands out in the review data.
"Caplena is strong on automated topic detection and sentiment analysis, including topic-level sentiment, which helps when a single comment contains mixed feedback. The interface supports iterative refinement of classifications, making it practical to improve quality over time. Segmentation and filtering are well supported via metadata, which is useful for drilling down by customer characteristics, channels, or time periods. Export options also make it easier to validate results and continue analysis in other tools. From a compliance perspective, the anonymization capabilities and multilingual support are meaningful strengths for teams working with sensitive verbatim data. As a European, Swiss-based solution with EU data hosting, Caplena is also a strong fit for organizations with strict GDPR and data residency requirements..."
- Caplena review, Nora W.
"The code frame generation is not the best. It always needs a lot of refining and editing; I have to delete irrelevant topics and add topics that have been missed. It would be great if the code frame generated were closer to the end product. We rely on using already existing code frames to save time. There is not much flexibility in editing the charts. Also would be nice to download the chart for PPT."
- Caplena review, Rachel L.
Dovetail is the platform that UX researchers, product teams, and research operations functions use to turn interview recordings, survey responses, and qualitative notes into a searchable, shareable repository of insights. Auto-transcription, AI-assisted tagging, and highlight reel creation are housed in a single environment, keeping past research discoverable and alive.
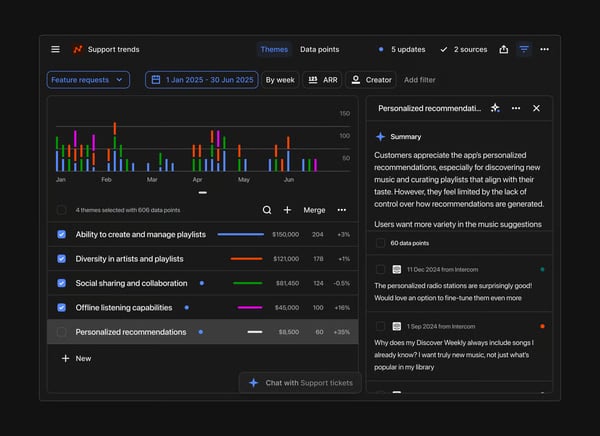
Auto-transcription is the feature teams reach for immediately after onboarding. Reviewers using the tool say that What your researchers walk away with is time back from one of the most consuming steps in the qualitative research cycle, manual transcription is removed from the workflow, with tagging and theme detection starting straight away. No-code pulls 88% in G2 Data, and the transcription and tagging workflow stays accessible to researchers at every technical level.
The tagging system lets researchers tag specific sentences or moments across transcripts, automatically grouping tagged clips with every other instance of the same theme across the full dataset. Reviewers mention this as the capability that makes patterns visible at scale, surfacing connections between interviews that manual review would take days to find. The users' comments about this one, combined with the tool's integration capability score at 81% on G2, show how smoothly tagged insights flow into Slack, reports, and stakeholder presentations without file transfers.
All research, past studies, transcripts, and tagged insights live in one searchable repository that any team member can query. Retrieving answers from prior research without re-running studies becomes routine, reducing duplicated effort and keeping institutional knowledge accessible as team membership changes. The repository model is what separates Dovetail from tools that treat each project as a standalone exercise with no memory of what came before.
Highlight reels let researchers pull the most relevant interview moments into stakeholder presentations without video editing software. Teams share clips directly into Slack or embed them in reports, and researchers cite this as the reason non-research functions start treating customer feedback as something worth paying attention to.
AI-generated summaries give researchers a starting point for synthesis immediately after interviews are uploaded, compressing the time between data collection and preliminary findings. With ease of use sitting at 87% on G2, researchers say it quickly orients them before they start deeper tagging. And when product cycles move fast, summaries alone cover early-stage stakeholder updates without waiting for a full analysis pass.
Collaboration across teams is built into the core workflow. Researchers, product managers, and designers can comment, tag, and build on each other's work inside the same project without exporting or reconciling separate documents. Dovetail reduces the information silos that form when research lives in individual folders, giving teams the visibility across concurrent studies that most research cultures have quietly accepted as unsolvable.
Across G2 reviews, advanced project organization has a defined boundary when multiple teams use the platform simultaneously. Structuring projects, managing permissions, and maintaining a clean taxonomy across a large repository takes careful planning, but the platform's onboarding process doesn't walk them through it well. The upside is that it's a one-time setup cost: once the structure is in place, maintaining it is straightforward, and teams that lean on Dovetail's admin documentation get there faster.
Pricing draws consistent feedback in G2 reviews, particularly from teams moving through plan tiers. Features previously available on lower plans have shifted to higher tiers, and the cost step-up is described by multiple reviewers as disproportionate to the incremental capability gained. That said, the AI features being added at higher tiers are the ones that cut the most manual work, so teams with growing research volume may find the upgrade worthwhile.
Dovetail is the strongest option for research and product teams that need qualitative data to be organized, searchable, and shareable across the organization. The teams that get this right make customer understanding part of every decision, not a solo research task. And that, closes the gap between what customers need and what the business delivers faster than any roadmap alone..
"Dovetail's continuous desire to improve is honestly its most attractive feature. I first made the case to use it at our company over two years ago. Today, as the head of research and strategy, I've turned into a key part of our researcher onboarding for every engagement for our Fortune 300 enterprise clients."
- Dovetail review, Rashina B.
"I found the initial setup of Dovetail quite difficult and time-consuming. The early version of the product required substantial effort to establish a tagging system, templates, and other necessary configurations. I also struggle with organizing files and projects when multiple teams are using Dovetail, as it becomes challenging to manage and sort through the various documents and initiatives efficiently."
- Dovetail review, Milos D.
Still deciding where your review data should come from? The best media monitoring software helps teams track brand mentions before analysis begins.
Speak turns audio recordings, video files, and meeting transcripts into searchable, analyzed text without manual transcription. Researchers, journalists, marketers, and qualitative analysts use it to process interviews, focus groups, and recorded meetings. With this tool, you can turn your raw recording into structured insight without opening a second tab. Sentiment, key themes, and summaries are delivered via a no-code interface, covering the full pipeline from raw recordings to analysis within a single environment.
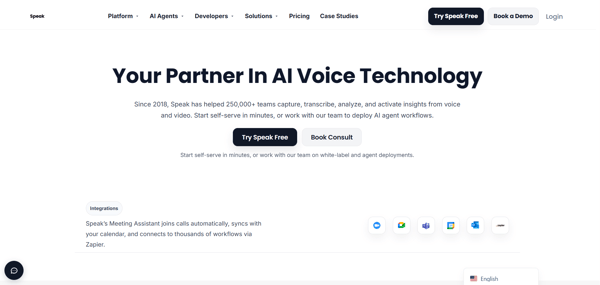
Teams reach for transcription accuracy first, and multilingual quality is what keeps them coming back. The turnaround numbers in G2 reviews caught my attention. Reviewers say manual transcription is reduced significantly, with outputs accurate enough to drop directly into reports with minimal cleanup.That kind of time recovery changes the pace of an entire research cycle.
Meeting recording and summarization allow teams to capture and analyze conversations without manual note-taking. Speak joins calls, documents the conversation to produce a summary capturing key points and sentiment. It then turns meeting content into usable insights immediately after the call. Speak's 98% maintenance score on G2 reflects exactly that: it holds up across ongoing use without demanding upkeep to stay reliable.
Magic Prompts lets users query transcripts and audio datasets conversationally, generating outputs in various formats, such as social posts, reports, or summaries. This enables non-technical users to derive meaningful outputs without switching tools. This is clearly reflected in the tool's 98% no-code score rating in G2 Data.
Sentiment analysis and keyword extraction run automatically across transcripts, giving teams a structured view of tone, recurring themes, and notable phrases without manual coding. Also, G2's 96% sentiment analysis score backs this up. The results stay accurate even when you're analyzing multiple sessions simultaneously. Verbatim-level access keeps raw evidence available alongside every automatic classification, which is what gives qualitative researchers the confidence to act on the output.
Integrations with Google, Zapier, and API access let teams embed Speak into existing content and research pipelines without manual file transfers. Transcription, tagging, and export run automatically from recording to destination — keeping the workflow moving without human intervention at each step. Integration scores at 95% in G2 Data highlight what teams consistently report: reliable connections across both technical and no-code setups, making adoption practical.
Support stands out sharply in recent G2 reviews. Reviewers describe getting responses from real people on nuanced issues, not routed tickets, with the Speak team proactively building features in response to direct user requests. A 100% on ease of doing business rating on G2, the highest in the category, reflects how seriously they take the post-sale relationship. In my reading of the reviews, it's one of the most consistently cited reasons teams renew.
I also noticed G2 reviewers flag pricing as a friction point for teams with inconsistent or variable usage patterns. Teams with uneven usage patterns tend to find the subscription cost harder to justify between heavy and light periods, and a pay-as-you-go model would suit them better. That said, G2 reviewers note the pricing as manageable once usage patterns are established, and the platform's free tier and trial period give teams a low-risk way to validate fit before committing.
Transcription accuracy for less-common languages and regional dialects came across as another limitation worth flagging. G2 reviewers working outside English and major European languages describe accuracy dropping enough to require more post-transcription editing. From what I found in the reviews, teams working primarily in English or widely supported languages don't encounter this. Speak's multilingual coverage is expanding, and for the languages it handles at full strength, transcription quality is praised by many reviewers.
Speak delivers for small teams and independent professionals who need high-accuracy transcription and qualitative analysis without manual overhead or complex setup. The no-code interface, sentiment analysis, and a support model that responds like a team invested in your outcomes take users from raw recording to structured insight without friction. As per my assessment of G2 reviews, the pace at which Speak unlocks changes the way qualitative work is done.
"User-friendly features and ease of use produce an incomparable and crisp result. Speak AI's best part is their invention of 'Magic Prompt,' which does magic. Simply Superb! I've been using Speak Ai for over a year now, and it has truly transformed the way I handle transcription, subtitling, and translation. The team behind it consistently updates the software, making it more user-friendly and efficient. One feature that stands out is its remarkable ability to produce concise and accurate summaries. I've shared feedback several times regarding the Tamil speech-to-text function, and I'm thrilled to see significant improvements. The accuracy has reached impressive levels, and the enhanced speed saves me a great deal of time. Speak AI continues to evolve, delivering tools that cater perfectly to my needs."
- Speak review, Maria S.
"Just the cleanup process to make sure my notes are accurate. It's pretty minor, though."
- Speak review, Ted H.
Amazon Comprehend is Amazon Web Services' (AWS) managed NLP service, built for developer teams. Sentiment analysis, entity recognition, keyphrase extraction, topic modeling, and PII detection run through API calls that plug directly into existing AWS infrastructure.
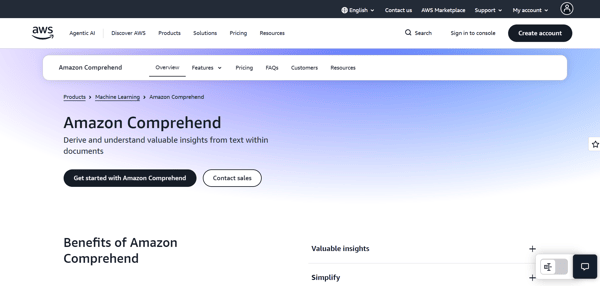
Developer teams already running workloads on S3, Lambda, and Glue add text analysis to their pipelines without adding separate NLP tooling to their stack. What clicked for me in the reviews is how consistently that pipeline simplicity holds, requiring no additional infrastructure and new tooling decisions. Customer feedback classification, document processing, and sensitive data detection all run within the AWS security and compliance boundary.
Topic modeling applies across news corpora, customer reviews, and support transcripts, surfacing recurring themes at volume without manual tagging. Accuracy holds across general-purpose text well enough for production pipelines. With a 91% topic analysis score in G2 Data, teams route it into automated content categorization workflows as a first deployment. A pattern that shows up across the reviews as a reliable starting point before expanding to more complex use cases.is why teams.
Sentiment analysis returns confidence scores alongside classifications, so your developers stop babysitting every classification. Uncertain cases route to manual review automatically, while high-confidence results run through without intervention. That split keeps accuracy high without requiring humans to review every response. At 89% on G2, it holds up across the document types and feedback channels that AWS-native teams typically process at scale.
The tool's personally identifiable information (PII) detection feature enables users to identify specific information about an individual's identity across emails, documents, and transcripts with no prior ML model configuration needed. For teams handling sensitive client data, that means a meaningful compliance step gets handled inside the existing AWS environment without additional tooling. G2 reviewers describe getting it into their codebase in under a day, and an 88% security rating on G2 reflects how consistently it holds up once running.
Teams already standardized on AWS pick Comprehend precisely because nothing needs to be wired outside the console. That's because the tool sits natively inside AWS and connects to S3, Lambda, Glue, and KMS without custom connectors. Hence, data never leaves the AWS environment, and Identity and Access Management (IAM) handles access control consistently across services. An integration score of 88% on G2 reflects what that means in practice for your team: no additional connectors to maintain, no security boundary to manage separately, and no new infrastructure decisions to make.
Batch processing lets teams analyze millions of documents in parallel, compressing the time between data ingestion and insight, without slowing down as volume grows. Comprehend supports both batch processing for large corpora and real-time inference for live workflows — the processing mode fits the pipeline rather than the other way around. That flexibility is what makes it viable for production at scale, and G2 reviewers reflect that. An 83% automation score on G2 confirms that teams running it in production find the processing range consistent and reliable across both modes.
Custom entity recognition lets teams train Comprehend to identify domain-specific terminology beyond standard model capabilities. And this is the one I noticed most in the reviews. Legal, financial, and healthcare developer teams highlight training custom models to recognize specialized language that pre-trained models miss, extending accuracy into domains that would otherwise need purpose-built NLP infrastructure entirely.
G2 reviewers consistently flag per-unit pricing as a growing concern at production scale. Per-API-call costs compound as inference frequency and data volume increase, and teams running continuous large-scale workloads describe the cost trajectory as faster than they anticipated. Teams with existing AWS committed spend may not face issues in this case. For teams on standard pay-as-you-go arrangements, the free tier covers enough volume for development and evaluation, giving them room to validate use cases before committing to a usage level that drives costs up.
The pre-trained models perform well on standard English text but have a defined scope for contextually complex language. G2 reviewers note that sarcasm, irony, and ambiguous phrasing produce less reliable classifications than straightforward sentiment or entity tasks. Teams processing standard business content generally don't face any such limitations. Custom model training addresses domain-specific gaps, and general-purpose NLP workflows run accurately through the pre-trained models for the vast majority of use cases teams bring to the platform.
Amazon Comprehend is the default call for AWS-native developer teams that need managed NLP without building and maintaining custom models. Ecosystem integration, batch processing, and PII detection cover the core production requirements cleanly. The review data made this one pretty straightforward for me. Your AWS-native teams get serious NLP capability added to existing pipelines without a single custom connector or separate infrastructure decision.
"Amazon Comprehend is easy to use and set up services for use. This is to make complicated tasks and raise a ticket to make a complaint. Developers can get started quickly and start analyzing data."
- Amazon Comprehend review, Anusha M.
"Need to integrate and consume the data on our own as part of your design. For example, if you send a full transcript, you will get back a single sentiment score set. You need to break the transcript into parts and submit each individually."
- Amazon Comprehend review, Tony L.
Kimola removes the technical barrier from customer feedback analysis. Paste a link from Trustpilot, Amazon, or a social platform, and your research cycle shrinks from days to hours, with the platform scraping, classifying, and theming data automatically. Sentiment scores, thematic breakdowns, buyer personas, and exportable PowerPoint reports come back without any model pre-training. I think that zero-configuration output is what makes Kimola stand apart for brand teams, CX functions, and market research consultancies.
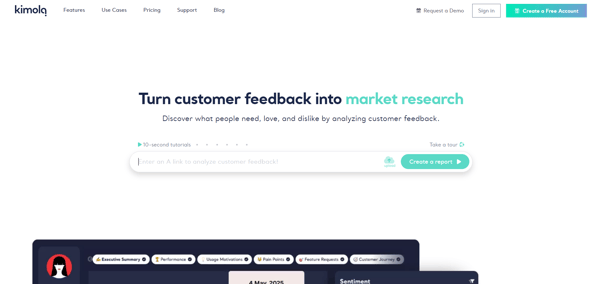
Auto-classification assigns themes to customer feedback immediately after upload. My analysis of G2 reviews found that users appreciate the tool's ability to analyze over ten thousand reviews in a single session and automatically generate an executive summary, pain point breakdown, and feature request list. No-code earns a 98% score on G2 Data, the strongest feature on the platform, reflecting how teams can get accurate outputs without configuration.
Sentiment analysis runs at the theme level, giving teams a granular view of how customers feel about specific product attributes and service moments. With a 96% sentiment analysis score on G2, consultancy teams applying it to competitor reviews describe accurate classifications across thousands of comments without manual correction, and that granularity is what struck me in the review data as the reason teams cite for switching from broader social listening tools.
Link-based scraping pulls reviews from Trustpilot, Amazon, and Google by pasting a URL; no data exports or API configurations are needed. Competitor research and first-party reviews are immediately available side by side, enabling faster, more informed comparisons. The auto-generated comparison views hand teams' presentation-ready outputs without any manual work, supported by data visualization rated 97% on G2.
Multi-label classification assigns more than one theme per comment, capturing the full range of topics raised by a customer. While scouring G2 reviews, I noticed that teams processing long-form reviews and call center transcripts describe thematic accuracy good enough to base real decisions on. Language identification hits 97% on G2, with consistent classification and sentiment output across multiple languages within the same dataset.
AI-generated summaries produce executive narratives covering themes, pain points, expectations, and feature requests from the full dataset. The synthesis step that typically adds hours to a research cycle disappears entirely. Teams drop these summaries directly into client presentations without significant editing, and the speed from data upload to client-ready narrative is what G2 review base describes as the sharpest operational change the platform delivers.
PowerPoint export generates structured reports covering themes, sentiment, personas, and comparisons in slide format. Your client gets a deck that needs minimal editing before the meeting, and the manual work of translating platform data into a presentation is gone. Reviews highlight downloading a report and going straight to delivery, and I find that turnaround changes the pitch entirely for consultancies where speed is a competitive edge.
I found several G2 reviewers point to the onboarding experience as a challenging point, with newer users finding the guided structure thin enough that getting up to speed independently takes longer than expected. This includes steps like credit purchasing that add friction during active research cycles. Though once the initial ramp-up is complete, the same workflow that felt unfamiliar starts delivering fast, giving reliable results without the overhead. Kimola's support team is also consistently described as responsive during this period, which hints that the ramp-up rarely stalls without a path forward.
G2 feedback points to a consistent constraint in how outputs are packaged for delivery. Export files surface raw panel data without a structured executive narrative, requiring additional reshaping before client delivery. PowerPoint exports follow Kimola's own template, meaning teams with strict corporate branding requirements will need to do some post-export editing. Yet the analytical depth and structured output quality behind each export are strong enough that the reshaping rarely takes long before it's ready for professional client delivery. For teams where speed matters more than template control, the time saved on analysis more than offsets the time spent on formatting.
Kimola delivers for brand, CX, and consultancy teams that need fast, accurate feedback analysis without technical setup. No-code classification, multi-language sentiment scoring, and auto-generated reports compress research cycles that compound across every project. Reviews consistently indicate that the platform is most effective for teams where research turnaround speed matters, with users frequently praising how quickly they can generate actionable insights.
"We've analyzed 5 different brands and product reviews from Trustpilot and Amazon with Kimola. It was super easy to scrape reviews by pasting a link, auto-themes were very accurate, and we loved the multi-label classification. It helped us analyze over 10,000+ reviews in 2-3 hours, and in the end, we had an executive summary, comparisons, pain points, feature requests, even customer journey…. and exported as a PowerPoint, PDF, and Excel… Everything that we needed in customer research. For Amazon, it also got attributes from reviews like pack size and flavor, which was something that we had never seen in another tool."
- Kimola review, Demir C.
"The export outputs mainly consist of the raw data displayed on the panel. Incorporating more executive summaries and a dashboard-style presentation could add significant value."
- Kimola review, Berkant K.
ATLAS.ti is where qualitative researchers who have outgrown manual coding spreadsheets and basic tagging tools tend to land, and researchers who arrive here mentioned in the G2 reviews that they rarely look back, and I get why. The platform handles interviews, PDFs, images, audio, and video inside one project environment, supporting iterative, multi-source analysis that dissertations, funded research, and mixed-method studies demand. It runs natively on macOS and Windows, with a web version for collaborative work built on decades of academic refinement.
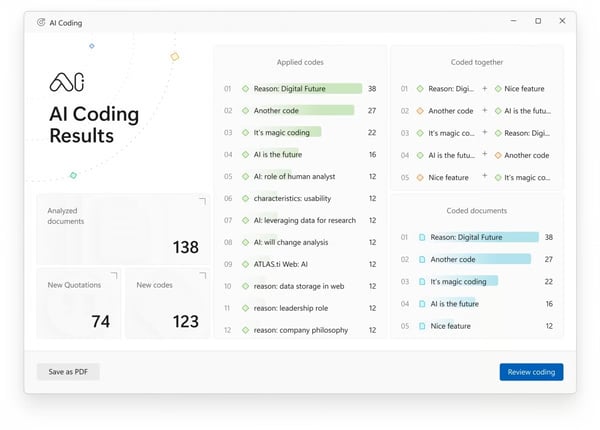
Researchers can use the tool to apply their interpretive frameworks and leverage the automated suggestions simultaneously. This allows manual and AI-assisted coding to sit side by side, and gives researchers the flexibility to move between inductive and deductive approaches within a single project without switching tools.
Most tools return a single sentiment score per document. Code co-occurrence tables go further, showing how frequently codes intersect across the full dataset, so structural relationships between themes become visible when every co-occurrence is mapped. Researchers use these tables to build theoretical models and validate interpretive decisions with structural evidence. Going through the review data, this feature stood out as one of the most liked ones. The 94% score for meeting requirements in G2 Data backs that up in practice.
Network visualization maps relationships between codes, quotations, and themes as navigable diagrams, giving qualitative analysis a visual layer that supports both interpretation and publication. Researchers pull semantic networks directly into dissertations and journal articles to represent the structure of their findings. The ability to move from coded data to a publication-ready diagram inside the same environment removes a production step that previously lived in separate software.
Multi-format handling is what makes ATLAS.ti practical for the complex mixed-method designs that single-format tools can't accommodate. Text, PDF, audio, video, and image files all sit inside the same project, so your triangulation study doesn't need parallel workflows to hold it together. Researchers code interview transcripts, photographs, and supporting documents together, cross-referencing findings across all of them in one consistent pass.
The query search function retrieves specific content across entire document libraries, making large-corpus management practical for researchers working across hundreds of PDFs or thousands of transcript pages. While going through the G2 data, I noticed this one keeps coming up specifically for corpus-heavy researchers building systematic literature reviews. They describe it as what makes volume manageable without losing the granularity that close reading requires.
Automated coding suggestions identify relevant passages and propose code assignments across large datasets, reducing the manual effort of initial code application without removing researcher control. Those working with extensive interview corpora use suggestions to locate candidate quotes before reviewing and confirming them, compressing time between data collection and preliminary analysis. I feel that balance of AI assistance with full override is what makes it credible for serious academic work where methodological precision isn't negotiable.
G2 users report system errors appearing under heavy load with large datasets. The output visualization layer also draws feedback for its limited chart types, with reviewers noting the absence of standard formats like pie and bar graphs. That said, the support team is described by G2 reviewers as quick to respond, reliable and consistent in resolving issues. The visualization gap is partially offset by export compatibility with Excel and SPSS, where additional chart types can be built from the exported data.
Some G2 reviewers mention the version upgrade model as a concern , particularly for individual and student researchers. The platform earlier required purchasing a new license for major version releases rather than offering a lower-cost upgrade path, a structure that feels disproportionate for those not covered by institutional agreements. However, the analytical depth ATLAS.ti provides continues to justify the investment for researchers, where the platform is central to their methodology.
ATLAS.ti is the platform of choice for researchers who need analytical depth, methodological rigor, and multi-format data handling in one environment. With this tool, your research methodology gets coding flexibility, network visualization, and AI assistance that serious qualitative work actually demands. I think the depth here is worth it for any researcher where precision is non-negotiable, and the decades of academic refinement behind it show in every layer of the platform.
"The software is straightforward to understand and follow instructions. The built-in flexibility allows for a lot of innovation in that it helps especially in developing codes which can be manual or automated as well. For functions like literature reviews, I found the software to be an essential tool that organizes data quickly and in a short time. The software is also handy for various types of data, including pictures and global positioning."
- ATLAS.ti review, Andrew C.
"Sometimes the system makes an error when you have a bunch of datasets. However, with the support team chat system, they are happy to help me!"
- ATLAS.ti review, Frensen S.
|
Software |
G2 rating |
Free plan |
Ideal for |
|
Google Cloud Natural Language API |
4.3/5 |
Yes |
Developer teams building custom NLP pipelines within existing infrastructure |
|
SAS Viya |
4.3/5 |
No |
Enterprise analytics teams need text mining alongside data science and modeling |
|
Chattermill |
4.4/5 |
No |
CX teams unifying and analyzing customer feedback across multiple channels |
|
Canvs |
4.3/5 |
No |
Media and insights teams analyzing emotion and open-ended survey responses |
|
Caplena |
4.5/5 |
No |
Research and CX teams coding and analyzing open-ended survey data at scale |
|
Dovetail |
4.5/5 |
Yes |
UX researchers and product teams synthesizing qualitative data and interviews |
|
Speak |
4.9/5 |
No (Limited)* |
Small research teams transcribing and analyzing audio and video data |
|
Amazon Comprehend |
4.3/5 |
Yes (Limited)* |
AWS-native teams running NLP and sentiment analysis at scale |
|
Kimola |
4.8/5 |
Yes |
SMB and mid-market teams analyzing consumer reviews and social feedback |
|
ATLAS.ti |
4.7/5 |
No (Limited)* |
Academic and qualitative researchers doing deep coding and annotation work |
*These software products are top-rated in their category, based on G2's Spring 2026 Grid Report.
*Free tier plan available. Check the vendor website for more details.
Got more questions? G2 has the answers!
Chattermill and Kimola are the strongest options for customer feedback insights and sentiment tracking. Chattermill's sentiment analysis scores 89% in G2 Data, the strongest result across its full feature range, and pulls App Store reviews, NPS responses, and support transcripts into one unified view. Kimola scores 96% for sentiment analysis and runs it at the theme level, giving teams a granular read on how customers feel about specific product attributes rather than a single overall score.
SAS Viya and Google Cloud Natural Language API are the platforms data scientists return to most. SAS Viya keeps data preparation, text mining, machine learning, and model deployment inside one cloud-native environment that natively supports SAS, Python, and R, so data scientists keep their existing workflows without retraining on proprietary syntax. Google Cloud Natural Language API extends into AutoML for teams that need to build and deploy custom classifiers, with an integration score of 87% in G2 Data reflecting how well it holds together across the wider GCP ecosystem.
Caplena and Chattermill are the strongest picks for multilingual content monitoring and global research programs. Caplena scores 89% for language identification on G2 and lets research agencies upload mixed-language datasets and receive consistent topic and sentiment classification without routing non-English responses to separate tools. Chattermill scores 87% for language identification and holds steady across non-English sources, removing the need for separate regional analysis workflows when feedback comes in from multiple countries.
Amazon Comprehend and Google Cloud Natural Language API post the strongest accuracy benchmarks for enterprise-scale text processing. Amazon Comprehend's sentiment analysis scores 89% on G2 and returns confidence scores alongside classifications, so uncertain cases route to manual review while high-confidence results run through without intervention. Google Cloud Natural Language API's named entity recognition holds a 92% feature rating in G2 Data and stays accurate as input formats shift across financial, healthcare, and e-commerce documents.
Amazon Comprehend and Kimola are the strongest fits for categorizing feedback and surfacing trends. Amazon Comprehend's topic modeling scores 91% on G2 and surfaces recurring themes across news corpora, customer reviews, and support transcripts at volume without manual tagging. Kimola auto-classifies themes the moment feedback is uploaded, and its no-code score of 98% on G2 reflects how little configuration teams need before trend patterns become visible across thousands of reviews.
Speak and Kimola are the easiest platforms to scale without adding setup overhead. Speak's no-code interface scores 98% on G2 and covers the full pipeline from raw recordings to sentiment and summary output inside a single environment. Kimola also scores 98% for no-code use and works by pasting a link from Trustpilot, Amazon, or a social platform, with no model pre-training required before insights come back.
Canvs and Caplena are the strongest options for interpreting sentiment inside open-ended feedback. Canvs scores 83% for sentiment analysis and accounts for entertainment-specific slang, emoji behavior, and informal language that general-purpose tools tend to miss. Caplena detects sentiment at the topic level, which reviewers note is especially useful when a single comment contains mixed feedback that a single overall score would flatten.
Caplena and Amazon Comprehend are the strongest picks for classifying survey responses at scale. Caplena combines AI-driven topic detection with a human-in-the-loop coding workflow, processing thousands of verbatims quickly while maintaining the precision that client-facing analysis requires. Amazon Comprehend supports both batch processing for large corpora and real-time inference, letting teams analyze millions of documents in parallel without slowing down as volume grows.
ATLAS.ti and SAS Viya are the strongest platforms for topic modeling and large-scale content analysis. ATLAS.ti's code co-occurrence tables show how frequently codes intersect across an entire dataset, making structural relationships between themes visible for researchers working with hundreds of documents. SAS Viya applies text mining across population-scale datasets inside the same cloud-native environment used for modeling and deployment, so content analysis doesn't require switching to a separate tool as data volume grows.
The recurring risks in G2 reviews fall into three categories: implementation complexity, pricing structure, and language coverage. SAS Viya's initial setup requires technical expertise across Kubernetes configuration and system integration, and licensing costs extend well beyond the license fee into infrastructure and maintenance. Dovetail reviewers flag that features once available on lower plans have shifted to higher tiers as usage grows. Canvs and similar platforms perform most reliably on English-language text, so teams running multilingual programs should confirm accuracy in their specific languages before committing to a rollout.
The best text analysis decisions aren't about picking the most feature-rich option. They come down to one honest question: where does your team's analytical workflow actually break down? Start there, and the right platform becomes clear faster than any feature comparison would suggest.
Don't wait for the perfect platform to show up. The gap between what your team needs today and what these ten tools already deliver is small enough to close now. Pick the one that matches your data volume, your technical capacity, and the channels your feedback actually comes from, then commit to it.
Don't pilot a platform in parallel with your existing process. Run it on a real workflow, with real data, connected to the sources your team actually uses. That's the only test that tells you whether it earns its place. Pick the one that fits how your team works today, implement it fully, and the manual review hours start disappearing fast.
Want to build more intelligent text pipelines? Explore natural language understanding software on G2 to find tools that take your analysis a layer deeper.


Let AI shortlist the best tool for your use case Ask AI 1 Click on the button below2...
 by Sudipto Paul

The best predictive analytics tools do more than forecast; they tell me when a model is...
 by Somya Jain

Recently updatedSummer 2026 Grid® Report · Published May 26, 2026 The 10 best...
 by Soundarya Jayaraman