


I evaluated 40+ tools using G2 Data and reviews to finalize the 8 best statistical analysis software. These are SAS Viya, IBM SPSS Statistics, Minitab Statistical Software, Base SAS, Posit Team, Orange, Qualtrics Market Research, OriginPro.
I'll admit it: I'm not a PhD statistician. I'm not out here writing structural equation models from scratch or building Bayesian inference pipelines to settle some academic debate. But as a content strategist (and someone who writes about analytics every day), I spent considerable time evaluating statistical analysis tools that go beyond Excel formulas and into the world where research, regulated industries, and data science actually live.
When most people think about data, they think about charts in spreadsheets, dashboards in BI tools, or numbers in a quarterly report. But behind every defensible insight is a layer of statistical analysis that turns raw observations into reliable conclusions. And to do that work without losing reproducibility, audit trails, or peer-review credibility, you need the best statistical analysis software built specifically for the job.
That said, I know the choice is rarely simple. Research statisticians need validated methods and publication-ready output. Quality engineers need DOE, capability studies, and SPC tools aligned with Six Sigma workflows. Data scientists need R and Python with reproducibility and governance. Educators, students, and analysts often prefer intuitive visual workflows over coding.
And the marketplace has also become crowded. More than 50 new statistical analysis products have been added to G2's category since 2021.
This list combines the best statistical analysis software to help you find the right fit. Whether you're looking for a user-friendly platform, advanced modeling capabilities, or software tailored for specific industries, you'll find options here that cater to newcomers and experienced data professionals.
* These statistical analysis software are top-rated in their category, according to the G2 Summer 2026 Grid Report for Statistical Analysis.
The best statistical analysis software gives you reliable, validated procedures for hypothesis testing, regression, ANOVA, and predictive modeling, replacing manual calculations with reproducible workflows. As I evaluated these tools through G2 reviews and reports, I saw how each one shapes day-to-day work for researchers, analysts, quality engineers, and data scientists across very different industries.
By analyzing G2 reviews and G2's Grid Reports, I gained a comprehensive understanding of each statistical analysis tool's features, ease of use, and overall value. I relied on verified reviews from industry professionals with hands-on experience to validate my findings.
Additionally, I used AI to analyze patterns in user feedback, ensuring I captured diverse perspectives on the software's effectiveness in providing reliable statistical procedures, supporting research and regulatory workflows, and enabling reproducibility across teams. The screenshots featured in this article are sourced from G2 product profile pages and publicly available materials.
By combining G2 insights with expert feedback, I've compiled a list of the best statistical analysis software to help you choose the right tool for your workflow.
Statistical analysis tools may look similar at a glance, but the experience of using them varies a lot once you go deeper. Here's what I focused on while evaluating each option.
The list below contains genuine user reviews from our best Statistical Analysis software category. To qualify for inclusion in the category, a product must:
This data was pulled from G2 in 2026. Some reviews have been edited for clarity.
SAS Viya is the cloud-native data and AI platform from SAS Institute, and it covers the full analytics lifecycle from data prep to model deployment, monitoring, and governance. The breadth is what sets it apart from a pure statistics tool: teams can run statistics, machine learning, MLOps, and decisioning on one stack instead of stitching point tools together. Recent updates added SAS Viya CoPilot for natural-language queries on statistical output and Text iQ for sentiment and text analytics, which is what positions the platform as the most actively evolving enterprise option in this list.
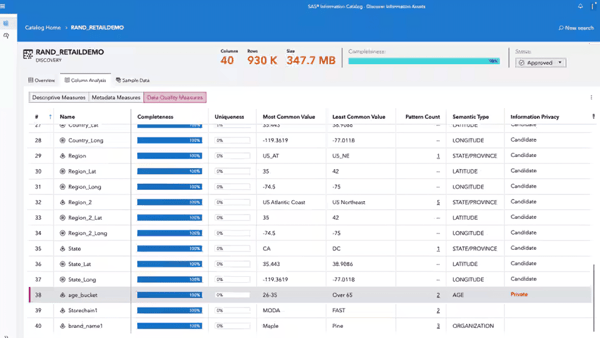 SAS Viya - Catalog Home
With 800+ verified reviews on G2, SAS Viya leads the Summer 2026 Statistical Analysis Grid Report on satisfaction, with a 91% likelihood-to-recommend score. Its customer base concentrates in pharmaceuticals, banking, and higher education.
What gets cited most often across SAS Viya reviews is the all-in-one analytics lifecycle. Reviewers describe consolidating data preparation, statistical analysis, machine learning, and decisioning into a single environment, which removes the friction of moving data between disconnected tools. For regulated workflows where every handoff between tools introduces audit risk, this consolidation is the productivity multiplier reviewers come back to.
Where SAS Viya pulls away from older SAS products is Python and R integration. Data scientists can bring existing scripts into the platform without rewriting in SAS syntax, which lowers adoption resistance in mixed-language teams. Verified integrations with pandas, Databricks, Snowflake, Apache Kafka, and PostgreSQL turn what used to be a SAS-only platform into a true polyglot environment for enterprise analytics.
A recurring theme in feedback I read is the drag-and-drop interface for non-programmers. The platform exposes complex statistical procedures through a visual canvas so business analysts can build dashboards and run regression or clustering analyses without scripting, while preserving full code access for those who want it. Reviewers, training analysts who do not write code, describe this dual-interface design as what made adoption viable across non-technical teams.
Reviewers running large workloads call out the cloud-native architecture consistently. The platform handles large datasets without the local-machine constraints reviewers describe with desktop statistical tools, and multiple enterprise reviewers describe rolling out SAS Viya across distributed teams without the per-machine licensing friction common to legacy SAS products.
A growing thread I saw in recent reviews is the AI capability stack. SAS Viya CoPilot for generative queries, AutoML for automated model selection, the AI Output Assistant for interpreting statistical results in plain language, and Text iQ for unstructured text analytics are highlighted as the differentiators that newer reviewers compare favorably against competing platforms. Reviewers specifically note that these features stay explainable and auditable, which matters when models need to be defensible to regulators.
Enterprise governance is built in rather than bolted on — pharmaceutical and financial services reviewers describe lineage, auditability, and continuous monitoring as core to the platform rather than an afterthought.
The cost side is the most common concern among reviewers. Several describe SAS Viya as expensive relative to open-source alternatives, with the per-user cost making broad organizational rollout an executive-sponsorship decision rather than a team purchase. Reviewers who weigh this in context note that the platform replaces multiple point solutions, so the cost is better evaluated against the consolidation savings than against single-product alternatives.
Another recurring theme is the learning curve, particularly for users new to SAS or coming from a single-language background. Mastering the full Viya ecosystem (modeling studio, decisioning workflows, governance tooling) takes sustained investment. SAS provides extensive training resources, and the platform's depth is what justifies the learning effort once teams reach productive use, which long-tenured reviewers describe as the moment Viya becomes hard to give up.
If you're leading analytics or data science at a regulated enterprise and need governance, lineage, and explainability built into the platform rather than bolted on, SAS Viya is one of the statistical analysis tools I'd recommend evaluating. From the G2 reviews I analyzed, the integration breadth and cloud-native architecture remain core strengths, while the SAS Viya CoPilot and AI Output Assistant updates expand what the platform can deliver beyond traditional statistical analysis into machine learning and decisioning.
"SAS Viya is a powerful analytics tool that combines AI, machine learning, and analytics in one platform. It's especially useful for clinical trials, where ensuring data accuracy and compliance is critical. The cloud-native setup makes it easy to scale, and the SAS CoPilot helps users get insights faster through natural language queries."
- SAS Viya review, Abhishek T.
"The user interface is a bit complex for first-time users, and switching between different modules sometimes feels disjointed. Performance can occasionally lag when dealing with very large datasets in the cloud. Also, the documentation, while detailed, is spread across multiple sources."
- SAS Viya review, Venkatesh D.
Related: Curious about how machine learning fits into modern analytics? See the best machine learning software on G2.
Few statistical packages have shaped academic research the way IBM SPSS Statistics has. Maintained by IBM, the platform is built around menu-driven workflows that expose multiple regression, factor analysis, and structural equation modeling without asking the user to write a single line of code. The version 32 release added an AI Output Assistant for natural-language interpretation of statistical output, a Mediation Analysis procedure, and refreshed algorithms, which addresses the longest-running reviewer complaint about the platform feeling visually dated.
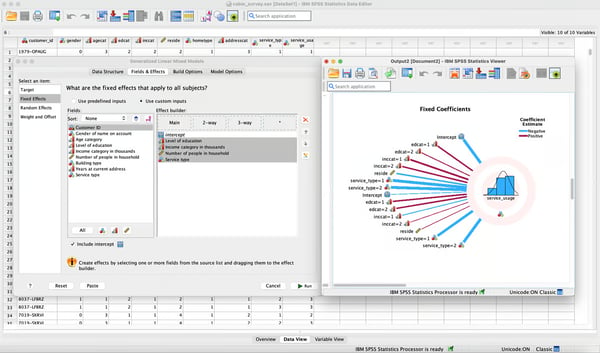 IBM SPSS Statistics - Data Editor
IBM SPSS Statistics has the largest Market Presence in G2's Statistical Analysis category. The customer base concentrates in higher education, research, education management, and market research, with a 43% enterprise share, a footprint that reflects decades of embedded use in academic and research-services environments.
The strongest theme in SPSS reviews is the menu-driven interface for complex procedures. Reviewers describe running multiple regression, factor analysis, and structural equation modeling without writing code, which makes SPSS uniquely accessible to social scientists, healthcare researchers, and graduate students who need statistical depth without becoming programmers first.
Tied to that is accessibility for non-programmers. SPSS does not assume the user comes from a computer science background, and reviewers from psychology, sociology, healthcare, and education repeatedly note that the platform met their statistical needs without requiring them to learn R or Python. With 17 supported languages and a long history in education, the product has built a trained user base that newer tools cannot easily match.
Reviewers in healthcare and pharmaceuticals come back to reliable output for compliance and publication. SPSS output formats are accepted by journal reviewers, the procedures are documented and validated across decades, and the platform's stability matters when results need to be defensible in peer review or regulatory submissions. For research teams that publish frequently, this output reliability is what keeps SPSS in the workflow.
A recurring point is strong data management capabilities. Data preparation, recoding, file merging, and case selection all happen through dialog-driven workflows, which keep the bulk of an analysis project in one tool rather than splitting it across Excel and a stats package. For research projects with repeated cleaning and recoding cycles, that consolidation saves real time.
Reviewers also describe its AI assistant as helpful for translating dense statistical output into plain-language explanations, which is particularly valuable in teaching contexts and for analysts who need to communicate results to non-technical stakeholders. The Mediation Analysis procedure added in the same release is also called out by researchers who previously had to run mediation tests through macros or external add-ons.
Across the long tail of features, the breadth of procedures is mentioned by reviewers as the practical reason SPSS remains a daily-driver tool for research. From descriptive statistics through discriminant analysis, MANOVA, and survival analysis, SPSS is a single environment that covers most of what a research project requires without needing to add other tools.
Based on G2 reviews I saw, the menu-driven approach is what makes SPSS approachable, but some mention that the UI looks visually dated next to cloud-native competitors. Nonetheless, users note that the v32 release brought meaningful interface refreshes with the AI Output Assistant. Reviewers who weigh the depth of procedures against the interface generally describe the trade as worth it for research workloads.
Another recurring theme is performance with large datasets and the lack of native cloud collaboration. SPSS slows noticeably with very large datasets compared to platforms designed for distributed processing, and the on-premises deployment model means there is no browser-based collaboration option. For most academic and research workloads, desktop performance is sufficient, and where collaboration matters, reviewers describe exporting results to Tableau or Power BI for the presentation layer.
If you're a social scientist, healthcare researcher, market researcher, or student who needs solid hypothesis testing and reliable output without writing code, IBM SPSS Statistics is one of the statistical analysis tools I'd recommend evaluating. From the G2 reviews I analyzed, the menu-driven interface for complex procedures remains the product's defining strength, while the v32 AI Output Assistant addresses the long-running need to make dense statistical output accessible to non-statisticians.
"What I like most about IBM SPSS is the ease of use and reliability. It has a wide range of statistical procedures, from basic to advanced. The output is clear and easy to interpret, and the menu-based interface helps users without programming background to perform complex analyses confidently."
- IBM SPSS Statistics review, Rohith B.
"The interface looks dated and could use a refresh. Exporting visualizations to tools like Tableau or Power BI is not seamless, and the software can be slow when working with very large datasets. Pricing is also on the higher side for individual users or small research teams."
- IBM SPSS Statistics review, Ketan S.
Minitab Statistical Software is the tool Six Sigma practitioners and quality engineers have built workflows around for decades. Maintained by Minitab LLC for more than 50 years, it packages the methods that Black Belts and quality professionals reach for daily: capability analysis, control charts, Gauge R&R, response surface designs, and full factorial DOE. The platform is now available in desktop and cloud-based versions, which is a meaningful change from the historical desktop-only deployment and lets distributed quality teams collaborate on shared projects.
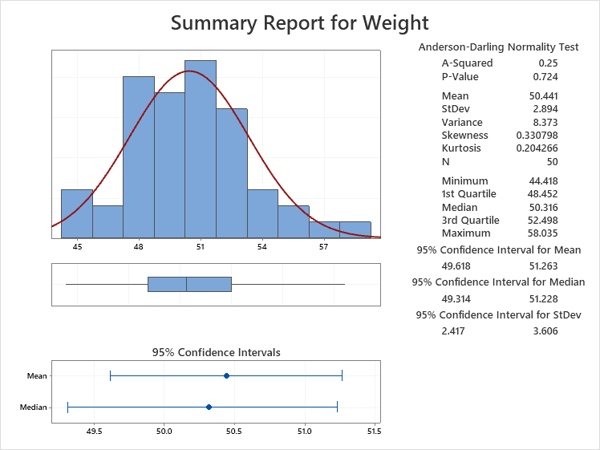 Minitab Statistical Software - Summary Report for Weight
Across 200+ reviews on G2 , Minitab earns the second-easiest-to-use spot in the Statistical Analysis category and reports the fastest implementation time in this list at one month on average. Reviewers concentrate in automotive, manufacturing, and medical devices, with a 47% enterprise share that lines up with the platform's place inside corporate quality programs.
The single biggest pull for Minitab is the Six Sigma and DOE specialization. Reviewers describe how the platform packages the methods quality engineers actually run, including capability analysis, control charts, Gauge R&R, response surface designs, and full factorial DOE, with workflows that match how a Black Belt approaches a project rather than how a general statistician would.
Right behind that is the Assistant feature. The guided workflow walks users through method selection and assumption checks, particularly for capability studies and DOE, which reviewers describe as what removes the guesswork from picking the right test. For analysts who run DOE or capability studies occasionally rather than daily, the Assistant guides them to the right procedure and explains the output in plain language.
Reviewers consistently call out clear visualization output. Minitab's charts, control charts, and DOE plots are publication-ready and handle the visual conventions that quality reviewers and auditors expect. For regulated industries that need defensible visual documentation, the output quality is part of why teams stay with Minitab year after year.
What turns up across most reviews I saw is a comprehensive statistical toolkit that covers descriptive statistics, hypothesis testing, regression, ANOVA, time series, and quality methods inside a single environment. Reviewers describe keeping a project in one tool from data import through reporting, which is part of why Minitab earns its second-easiest-to-use ranking despite the analytical depth underneath.
Worth noting is Excel import and data preparation tools, which work well for users coming from spreadsheet-based workflows. Subsetting, recoding, and joining all happen without a separate ETL stage, and Excel data moves into Minitab with minimal cleanup. For laboratory and manufacturing teams that capture data in Excel before analysis, this import flow is described as low-friction.
Closing the loop is audit-ready outputs, which matter disproportionately in regulated industries. Minitab's reports are structured to support quality documentation, internal audits, and customer-facing capability reports, which medical-device and automotive reviewers describe as defensible to both regulators and customers when results need to be presented in formal review.
For smaller teams weighing the total cost, the subscription model is worth factoring into the budget conversation. Reviewers who previously held perpetual licenses describe the ongoing cost as a bigger line item than they were used to. That said, Minitab's average implementation time of one month is the fastest in this category, which means teams reach productive use quickly, and the return on the subscription starts accumulating sooner than with platforms that take quarters to deploy.
Another recurring theme is around AI and machine learning capabilities which a few users note can improve. For most quality engineering workloads, this is not the central use case, and where AI features matter most, Minitab's strength remains in the specialized DOE, capability, and reliability methods that the platform was built around in the first place.
If you're a quality engineer, Six Sigma practitioner, or manufacturing analyst running DOE, SPC, or capability studies, Minitab Statistical Software is one of the statistical analysis tools I'd recommend evaluating. From the G2 reviews I analyzed, the Assistant feature for guided analysis and the Six Sigma method depth remain core strengths, while the new cloud-based version expands the platform's reach for distributed quality teams that previously had to share desktop installations.
"Minitab has been a reliable companion in my Six Sigma and quality improvement projects. The Assistant feature is particularly helpful, as it walks you through the analysis step by step and explains the output in simple language. The DOE and capability analysis tools are unmatched for manufacturing use cases, and the visualization is clean and publication-ready."
- Minitab Statistical Software review, Ravindra B.
"The subscription model is significantly more expensive than the one-time license we used to purchase, which is hard to justify for smaller teams. The interface, while functional, has not received a major refresh in years. Also, the platform's machine learning capabilities feel limited compared to newer tools."
- Minitab Statistical Software review, Wang Z.
Related: Running quality improvement work at scale? See the best quality management software on G2.
Base SAS is the foundation of the SAS System, a fourth-generation programming language designed for data access, transformation, analysis, and reporting. It's the regulator-trusted standard for clinical trial submissions, financial compliance work, and other use cases where a regulator expects SAS-formatted output. Base SAS runs as a desktop environment with cross-platform support across Windows, Linux, and macOS, and the SAS Studio web interface lets analysts develop in the browser without a local installation.
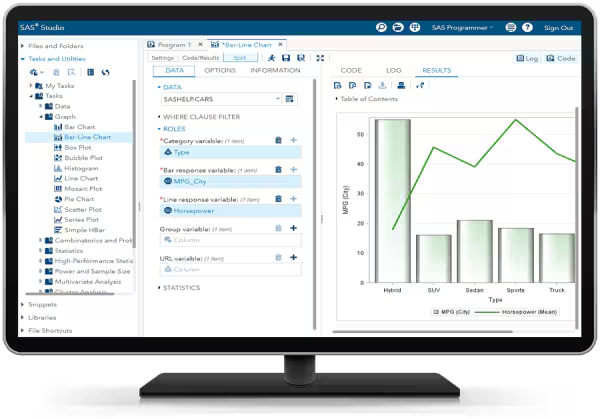 Base SAS - Bar Chart Generation
The 140+ Base SAS reviews on G2 tell a clear regulated-industry story: Base SAS holds the highest Quality Control feature score in the entire Statistical Analysis category at 95%. Its customer base concentrates in pharmaceuticals, banking, hospitals, and insurance, with a 51% enterprise share and a 75% on-premises deployment share that lines up directly with how regulated buyers prefer to run analytics.
What anchors Base SAS in regulated workflows is desktop SAS programming without cloud dependency. Reviewers describe the full SAS programming language and procedure library running on local hardware, using the same syntax that has been the standard in clinical trial submissions for decades. For teams where data residency and on-premises deployment are non-negotiable, Base SAS continues to be the default.
Reviewers handling complex data prep call out data integration capabilities consistently. Base SAS handles data from databases, mainframes, flat files, and Excel, with the SAS/ACCESS interface providing native connections to most major data platforms. Pharmaceutical and banking reviewers describe consolidating data from multiple regulated systems into a single analysis environment as a recurring strength.
The clinical workflow theme comes up across pharmaceutical reviews: regulatory submission workflows are where Base SAS plays its strongest role. Reviewers from pharmaceuticals and clinical research describe SAS programs validated for FDA submissions, output formats accepted by regulatory authorities, and integration with REDCap for clinical research data capture (the only verified integration on Base SAS's G2 profile, which itself underscores the clinical positioning).
Across reviews, legacy code reuse turns up as a quiet but critical advantage. Reviewers note that SAS programs written ten, fifteen, or twenty years ago still run in current versions of Base SAS, which means institutional analytics knowledge does not get lost when systems are refreshed. For organizations with decades of SAS-based reporting, this stability has significant compounding value.
Reviewers running mixed environments highlight strong ETL and reporting flexibility. Base SAS DATA step processing is described as the gold standard for row-by-row data manipulation in statistical contexts, with output that can be delivered in Excel, PowerPoint, PDF, and HTML formats. This reporting flexibility is a recurring point of differentiation from open-source alternatives that expose statistical procedures without the same publication-ready output layer.
Finally, cross-platform support with SAS Studio comes up as a useful flexibility for mixed-OS environments. Base SAS runs on Windows, Linux, and macOS, and the SAS Studio web interface lets analysts access the platform from any browser without requiring a local installation. For teams that need to grant access across multiple operating systems, this provides the flexibility without giving up the underlying SAS engine.
Something to consider based on the reviews I looked into is its pricing. Reviewers who weigh this against the platform's role in clinical and financial submissions note that institutions willing to invest in Base SAS gain access to a regulator-trusted environment that few alternatives can match for these workflows.
Another recurring theme is around the interface. Reviewers coming from modern IDEs note that the Base SAS editor is built for stability and precision over polish. The interface reflects decades of refinement for regulated workflows rather than the conversational features newer cloud-native platforms have prioritized. For teams where auditability and procedural consistency are the buying criteria, that trade is intentional: the same stability that makes the editor feel familiar to long-tenured SAS programmers is what keeps validated programs running unchanged across system refreshes.
If you're a SAS programmer or analyst working in pharmaceuticals, banking, insurance, or hospitals with workflows that depend on the SAS ecosystem and regulator-accepted output, consider Base SAS. From the G2 reviews I analyzed, the ability to execute legacy SAS code and integrate with clinical and financial data systems remains a defining strength, while the SAS Studio web-based interface expands access for analysts who prefer browser-based development.
"Base SAS facilitates seamless data integration across multiple sources, which is ideal for analytics work in regulated industries like pharmaceuticals. The DATA step processing is reliable and well-documented, and our clinical SAS programs from years ago continue to work without modification. The procedural library covers virtually every statistical method we need for clinical trial analysis."
- Base SAS review, Lisa M.
"Base SAS is powerful but pricey, and the interface feels dated compared to modern statistical platforms. There's no autocomplete in the editor, which slows down development for newer programmers, and importing Excel files can be quirky depending on the version. Setting up the environment for the first time also takes effort."
- Base SAS review, Satish R.
Posit Team is the commercial enterprise platform built around the open-source RStudio IDE that millions of statisticians, data scientists, and researchers already use. Maintained by Posit PBC (formerly RStudio), a Public Benefit Corporation, the commercial product layers Posit Workbench for centralized development environments across RStudio, VS Code, Jupyter, and the newer Positron IDE, Posit Connect for publishing Shiny applications and dashboards, and Posit Package Manager for security-compliant R and Python package management. The PBC governance is part of what makes Posit Team a credible long-term home for enterprise R and Python.
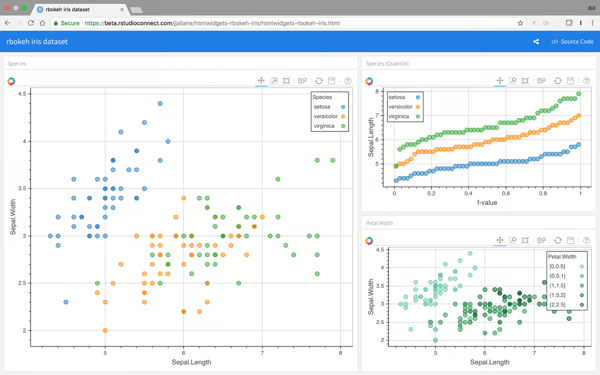 Posit - Iris Dataset
Posit Team carries 570+ verified reviews on G2 and posts the highest Regression feature score in the Statistical Analysis category at 96%, tied for the top position. Reviewers concentrate in higher education, IT services, research, and computer software, and the platform reports an average time to ROI of 7 months, the fastest in this list.
The open-source foundation comes up repeatedly in Posit Team reviews. Reviewers describe the freedom to choose R, Python, or Java for each problem without leaving the IDE, and Posit's stewardship of the underlying open-source tools means the technology remains a trustworthy long-term investment. Posit's Public Benefit Corporation status reinforces this for reviewers concerned about platform sustainability, particularly in higher education and research.
What practitioners call out as the productivity baseline is RStudio IDE quality. The IDE is described as the best development environment for R and increasingly for Python, with code editing, plot output, environment inspection, and help documentation in a single window. Reviewers describe this as the layout other IDEs are measured against, particularly for the iterative nature of statistical exploration.
For mixed-language teams, R and Python in one platform is the recurring theme. Reviewers describe switching between languages within a single project, sharing data between R and Python sessions, and using the language best suited to a given task without changing tools. For teams that previously had to run Python in one environment and R in another, this consolidation is the workflow win.
Reproducibility is the next recurring theme. Project structure in Posit encapsulates each project's files, libraries, environment configuration, and database connections, which makes analyses reproducible by colleagues and protects against the package-version drift that plagues R and Python workflows in the wild. With Posit Workbench, this reproducibility extends across distributed teams sharing development environments.
Documentation and community keep surfacing as the learning support that practitioners come back to. The R community, the Posit-maintained documentation, and the broad ecosystem of tutorials are described as a meaningful productivity advantage. For data scientists who learn through community examples and worked solutions, the depth of available resources is hard to match in the commercial statistical software space.
Finally, the free open-source on-ramp is what most reviewers describe as the path that brought them to Posit Team. Students, researchers, and small teams can start with the free RStudio IDE before any commercial decision, and that gradual path from learning to enterprise adoption is what made Posit Team viable as the enterprise standard once teams grew beyond individual workstations.
The learning curve is something to factor in for new users. Initial setup involves installing R separately, managing package dependencies, and learning the language syntax, which takes longer than menu-driven alternatives. The depth that experienced users praise is the same depth that new users find demanding at the start, and Posit's extensive documentation and large user community offset the curve as users gain experience.
Another recurring theme is performance with very large datasets. R and Python performance slows when datasets exceed what fits comfortably in memory, and reviewers describe pairing Posit with Databricks, Snowflake, or other distributed processing for the heaviest workloads. The underlying open-source RStudio IDE remains free, and the commercial Posit Team product is positioned as the production layer that adds governance and reproducibility on top of the existing language ecosystem, which reviewers describe as a reasonable cost trade for teams that have grown beyond individual workstations.
If you're a data science leader, statistician, or analytics team running R and Python at enterprise scale and need reproducible workflows with governance and security, Posit Team is one of the statistical analysis tools I'd recommend evaluating. From the G2 reviews I analyzed, the open-source RStudio IDE remains the platform's defining strength for the practitioner experience, while Posit Workbench, Connect, and Package Manager expand the platform's reach into production data science with reproducibility built in.
"Posit's leadership in the market and its ability to stay ahead of the curve by quickly adopting new technologies and paradigms is unmatched. The documentation is top-notch, comprehensive, and the community is responsive. Having R and Python supported in the same environment with reproducible project structure has been a game-changer for our team."
- Posit Team review, Bruno T.
"Setup took longer than expected, and figuring out some of the options wasn't very intuitive. There's also a bit of a learning curve with more advanced features. Occasionally, performance slows down when working with larger datasets, and we've had to integrate with Snowflake to handle our biggest workloads."
- Posit Team review, Gautam H.
Orange takes a different approach to the rest of this list. It's an open-source data analysis platform developed by the Bioinformatics Laboratory at the University of Ljubljana, and instead of menus or code, the entire experience is a visual canvas where users assemble analytical workflows by placing and connecting widgets. More than 100 widgets cover data input, preprocessing, visualization, modeling, and evaluation, plus add-ons for text mining, bioinformatics, image analytics, and time series. The breadth is unusual for a free tool.
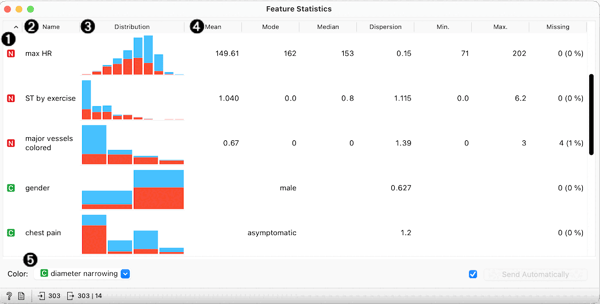 Orange - Feature Statistics
Orange's customer base is 62% small business, which lines up with the educational, prototyping, and research use cases that distinguish Orange from the commercial enterprise platforms here.
The drag-and-drop widget canvas is the first thing reviewers mention. Orange exposes machine learning and statistical procedures through a canvas where analysts connect widgets instead of writing code, which removes the barrier that excludes many learners and domain experts from data science. For analysts who understand the analytical approach but do not code daily, this visual interface is what made the platform usable for their workflow.
Right after that is the free open-source positioning. Orange costs nothing to install or use, which makes it the default choice for educational settings, individual researchers, and small teams without software budgets. The source code is available for inspection too, which matters in research contexts where reproducibility and method transparency are part of the publication process.
Reviewers describe the breadth of widgets and algorithms as the reason Orange covers more than just exploratory work. Data preprocessing, feature selection, clustering, classification, regression, and machine learning algorithms (naive Bayes, decision trees, neural networks) all live in the same canvas, with the option to extend through add-ons. Reviewers describe addressing most analytical challenges in a single tool rather than switching between platforms.
The visualization output is a meaningful strength in its own right. Scatter plots, heatmaps, dendrograms, box plots, and tree visualizations are interactive and quick to assemble, and the platform earns above-average marks on Data Visualization in the Grid Report. Reviewers describe the visual output as useful for both exploration and stakeholder communication, particularly in teaching contexts where visualizing model behavior matters.
One aspect to look into based on G2 reviews is around advanced statistical depth. Orange handles machine learning and basic statistics well. But for teams whose work centers on classical hypothesis testing or specialized statistical procedures, Orange is best paired with R or Python through its built-in scripting widget — a combination that preserves the visual workflow while extending the analytical depth. Reviewers who need that additional layer describe the pairing as straightforward, and for the teaching, prototyping, and exploratory contexts Orange is designed for, the visual canvas alone covers most of what the workflow requires.
Another theme is around enterprise deployment. "Orange is designed for desktop-first workflows with local data, visual exploration, and iterative prototyping, which is precisely the context its educational and research user base works in. Teams that move a workflow into production or need real-time data integration typically use Orange for the discovery phase and bring in a commercial platform for deployment, a transition that the free pricing makes easy to start without any upfront commitment.
If you're an educator, researcher, or analyst who wants to prototype machine learning and exploratory analysis without a coding background, Orange is one of the statistical analysis tools I'd recommend evaluating. From the G2 reviews I analyzed, the visual programming interface remains the platform's defining strength for accessibility, while the widget library and Python extensibility give experienced users a path to extend the platform when their workflows outgrow the visual canvas.
"Anyone can analyze with Orange. The simplest, easiest, aesthetic, most comfortable, and coolest features of Machine Learning. I have been training students, professionals, executives, and entrepreneurs using Orange for the last year, and it has been phenomenal. The visual interface makes complex concepts accessible to learners from any background."
- Orange review, Raman P.
"There is limited documentation for the more advanced use cases, and the platform could be better if it had clearer guidelines for newcomers to data science. Memory usage can become a constraint with larger datasets, and the advanced analytics options feel less developed than in dedicated statistical platforms."
- Orange review, Muhammad N.
Qualtrics Market Research is the survey-driven research platform that handles the full research lifecycle from study design through distribution, response collection, statistical analysis, and reporting. The platform is used by more than 13,000 brands including 75% of the Fortune 500, and the statistical capabilities live inside Stats iQ for AI-driven analytics and Text iQ for AI text analysis on open-ended responses. That positioning is what makes Qualtrics the right pick when statistics happen downstream of a research study rather than at the center of the workflow.
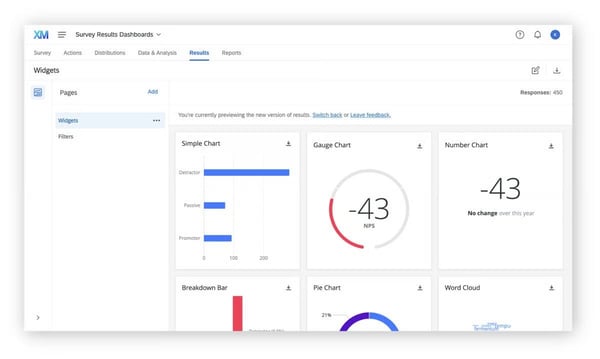 Qualtrics Strategy - Survey Results Dashboard
Few products in this list have an install base as large as Qualtrics Market Research. The platform carries 3,000+ verified reviews on G2 , and the Summer 2026 Grid Report puts its Collaboration score at 90%, the highest of any product here. The customer base concentrates in higher education, education management, and research, with a 46% enterprise share and 100% cloud deployment, lining up with the survey-research focus that distinguishes Qualtrics from the dedicated statistical platforms.
What gets cited most consistently is the survey design and distribution platform. Reviewers describe Qualtrics as the most flexible and reliable platform for building, launching, and managing research studies, with a drag-and-drop survey builder, more than 100 question types and templates, and PhD-backed methodology baked into the platform. For research teams that lead with study design rather than statistical procedures, this is the defining productivity gain.
Sitting alongside that is the integrated analytics through Stats iQ and Text iQ. In-platform analysis covers the most common survey-research procedures (descriptive statistics, ANOVA, regression, crosstabs) and runs directly on response data without an export step. Text iQ adds AI-powered text analytics for open-ended responses, which reviewers describe as a meaningful time saver compared to manually coding free-text answers.
A theme that surfaces across enterprise reviews is single-platform coverage of the research lifecycle. Qualtrics covers design, distribution, response collection, dashboard reporting, and stakeholder sharing without requiring separate tools at each stage. For organizations that previously stitched together SurveyMonkey, SPSS, Excel, and Tableau, the consolidation reduces tool-switching and gives researchers a single source of truth across the full study.
The ecosystem maturity comes up across enterprise procurement reviews. Integrations include Adobe Acrobat, Salesforce, Fuel Cycle, Google Analytics, Google Workspace, HubSpot, Microsoft 365, and Microsoft Outlook, with a REST API for custom builds. Combined with GDPR, HITRUST, ISO 27001, and FedRAMP compliance certifications, this is what gets Qualtrics through enterprise procurement where most survey platforms cannot.
Newer reviews increasingly call out the AI features. ExpertReview for survey-quality assurance flags methodological issues before a survey launches, predictive intelligence surfaces response patterns at scale, and AI text analytics finds themes in unstructured response data. Reviewers describe ExpertReview specifically as the quality check that protects the integrity of downstream analysis.
Worth highlighting is large-project reliability, which is what reviewers describe as the reason Qualtrics holds enterprise research budgets. The platform handles large-scale studies with high response volumes, complex branching logic, and distributed researcher teams without the performance issues that affect lighter survey platforms.
The learning curve is an aspect to look into for non-research professionals. The depth of features is described as demanding for users who do not run surveys regularly. The platform rewards investment in learning, and Qualtrics provides extensive training resources and consulting through Qualtrics Research Services for teams that want guided implementation, which research-focused users describe as a worthwhile trade once they reach productive use.
Another consideration for smaller teams or individual researchers is that Qualtrics is priced for enterprise research programs. Reviewers accessing it through institutional licenses describe it as excellent value, while those without that backing note that the cost can be difficult to justify for narrower or one-off projects.
Overall, if you're a research team running survey-driven studies, customer experience programs, or market research projects where statistical analysis happens on response data, Qualtrics Market Research is one of the statistical analysis tools I'd point to.
"Qualtrics Market Research has been very useful for wellness surveys, feedback collection, and research work. The survey logic, distribution options, and built-in analytics save us a lot of time. The AI features for text analysis are particularly helpful when we need to find themes across thousands of open-ended responses."
- Qualtrics Market Research review, Saksham S.
"The platform is powerful but takes time to learn fully. There are so many features that finding the right one for a specific task can be hard, and the cost is on the higher end. Performance can also lag a bit when you're working with very large response sets or running complex crosstabs."
- Qualtrics Market Research review, Carol M.
Related: Running survey research at scale? Check out the best survey software on G2.
OriginPro is the platform of choice for scientists and engineers who need publication-quality graphing paired with statistical analysis.
Maintained by OriginLab Corp., it covers descriptive statistics, t-tests, ANOVA, and survival analysis alongside specialized capabilities like peak fitting, surface fitting, signal processing, and image handling, plus quality improvement tools including Design of Experiments, Statistical Process Control, and Measurement Systems Analysis.
For laboratory and engineering workflows, OriginPro is the tool reviewers reach for when manuscript figures and curve fitting need to live in the same project, based on my understanding.
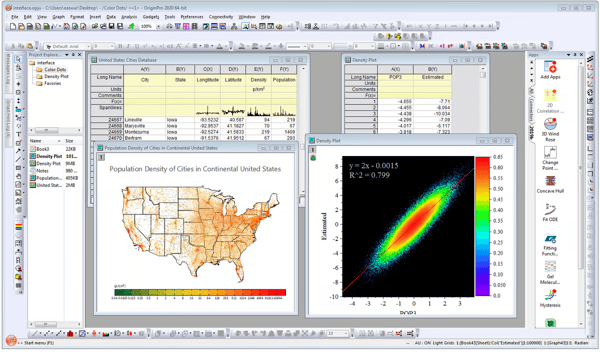 Originpro - Color Dot Interface
On G2, OriginPro carries the highest star rating of any product in this list at 4.7 out of 5 across 140+ verified reviews. Reviewers concentrate heavily on research, higher education, biotechnology, chemicals, and nanotechnology, which makes OriginPro the most science-focused product here. The customer mix (47% enterprise, 33% small business) reflects how laboratory teams of every size use the platform.
Publication-quality plots top every OriginPro review I saw. Two-dimensional, three-dimensional, contour, heatmap, and multi-panel layouts are described as journal-ready, with formatting controls that match the conventions of scientific publishing. Reviewers from chemistry, biology, and physics consistently call out OriginPro as their plotting tool of choice for manuscript figures.
Curve fitting is the next recurring theme I found. The nonlinear fitter handles complex models that other plotting packages cannot, including enzyme kinetics, dose-response curves, peak deconvolution, and exponential decay fits. For scientific workflows where curve fitting is the analytical centerpiece, OriginPro is the tool reviewers cite most, with built-in and customizable fitting models that match the depth required for serious scientific publishing.
What rounds out the analytical depth to me is statistics packaged alongside visualization. OriginPro combines descriptive statistics, hypothesis testing, ANOVA, regression, peak analysis, and signal processing with the graphing capability, which keeps an analysis project in one tool rather than splitting it across a plotting package and a stats package.
A distinctive signal across OriginPro reviews I saw is long-tenure user satisfaction. Reviewers describe using OriginPro across decades-long careers, with multiple reviewers in the ten- to twenty-year tenure range describing the platform as their consistent choice across multiple employers. That longitudinal pattern is a strong signal that the platform continues to serve its specialized user base well beyond first impressions.
Reviewers coming from spreadsheet workflows call out Excel integration and data import ease. Copy-paste data movement, formula fields, column-vector handling, and structured-data import all happen without preprocessing. For laboratory teams that capture data in Excel before analysis, this import flow is described as low-friction.
Another feature I'd highlight is the granular customization controls for manuscript figure preparation. The graph suggester recommends plot types for a given dataset, plot templates are built around scientific publishing conventions, and color palette controls can be matched exactly to journal style requirements. Reviewers describe this combination as the practical reason OriginPro saves hours per paper — the gap between a raw output and a submission-ready figure is narrower here than in any other platform in this list
One consideration for researchers working with complex 3D or multi-panel layouts based on G2 reviews I analyzed is that rendering and adjusting certain visualization types, 3D waterfall plots in particular, can feel slow, and some reviewers describe stacked display operations as more manual than they'd like. For the majority of 2D publication workflows OriginPro is built around, this is rarely a friction point, and the platform's continued investment in its Windows-native graphing engine means the core plotting experience remains the strongest in the category.
Another practical consideration I'd point to for Mac-based research environments is that OriginPro runs natively on Windows. Reviewers on Macs describe working through virtualization or dual-boot setups, which adds friction to onboarding new team members, though OriginLab's continued investment in the Windows-native experience means the core workflow remains unaffected for the majority of lab environments.
If you're a laboratory researcher, scientist, or engineer working on publication-quality figures alongside curve fitting and statistical analysis, I'd suggest OriginPro. From the G2 reviews I analyzed, the publication-grade visualization combined with curve fitting depth remains a core strength, while the broader statistical procedures keep an analysis project in one tool rather than requiring data export to a separate platform.
"I love the flexibility of OriginPro compared to other plot and figure-making software. Most of the essential to advanced statistical tests are included in the package, and the curve fitting capability handles the nonlinear models we need for our research. The plotting is publication-ready and saves us hours of figure preparation for each manuscript."
- OriginPro review, Marco D.
"One drawback is that OriginPro does not support macOS natively, I have to install a virtual machine or set up a dual-boot system, which is inconvenient and resource-intensive. Despite this limitation, I highly recommend OriginPro for any researcher who needs a robust and flexible platform for data analysis and scientific visualization."
- OriginPro review, Rui L.
Here's a quick glance of the G2 ratings, free plan availability and ideal use case for the top 8 statistical analysis software.
|
Software |
G2 rating |
Free plan |
Ideal for |
|
SAS Viya |
4.3/5 |
Free trial available |
Cloud-native enterprise analytics with explainable AI |
|
IBM SPSS Statistics |
4.2/5 |
Free trial available |
Menu-driven statistical analysis in social sciences research |
|
Minitab Statistical Software |
4.6/5 |
Free trial available |
Six Sigma and quality improvement workflows |
|
Base SAS |
4.4/5 |
No |
Desktop SAS programming in regulated industries |
|
Posit Team |
4.5/5 |
Yes (open-source RStudio IDE) |
R and Python data science at enterprise scale |
|
Orange |
4.2/5 |
Yes (open-source) |
Visual machine learning workflows without coding |
|
Qualtrics Market Research |
4.4/5 |
Free trial available |
Statistical analysis of survey research data |
|
OriginPro |
4.7/5 |
Free trial available |
Engineering and scientific publishing with curve fitting |
G2 ratings are based on user reviews and are subject to change over time.
Got more questions? Here are the answers.
Choose platforms built for the data scale: SAS Viya for cloud-native enterprise workloads, Posit Team paired with Databricks or Snowflake for distributed processing. Avoid desktop-only tools for very large data (IBM SPSS Statistics slows noticeably above certain thresholds), and prioritize reproducibility features that protect against silent breakages (Posit's project structure, SAS Viya's governance layer).
For programming flexibility, Posit Team leads with R, Python, and Java in one IDE, and SAS Viya lets data scientists bring existing Python and R scripts into the platform without rewriting in SAS syntax. For visualization, OriginPro holds the highest star rating in the lineup at 4.7 out of 5 and is the most-cited platform for publication-quality plots, while Orange's visual workflow canvas covers exploratory visualization without code.
Three layers reduce error risk: validated procedures (Base SAS programs run unchanged across decades, ensuring reproducible results), assumption-checking workflows (Minitab Statistical Software's Assistant guides users through capability and DOE assumption tests), and AI Output Assistants that translate results into plain language so users don't misinterpret p-values or effect sizes (IBM SPSS Statistics v32, SAS Viya). Posit Team's project structure also protects against package-version drift that can silently change results.
OriginPro holds the highest star rating, 4.7 out of 5 across 142 reviews, concentrated in research, higher education, biotechnology, and chemicals. For complex modeling at enterprise scale, SAS Viya leads with a 91% likelihood to recommend and embedded AI including AutoML and SAS Viya CoPilot, while Posit Team holds the highest Regression score in the category at 96% for data science teams.
Posit Team is the most-cited platform among data scientists, with 570 reviews on G2 and the highest Regression score in the category at 96% (tied for top). The free open-source RStudio IDE is widely used across higher education, IT services, research, and computer software, and the commercial Posit Team product adds enterprise governance through Posit Workbench, Connect, and Package Manager. SAS Viya is the next-most-trusted for data scientists in regulated enterprises where governance and explainability matter.
Modern platforms protect data through encryption at rest and in transit, role-based access controls, multi-factor authentication, and compliance certifications (GDPR, HITRUST, ISO 27001, FedRAMP where applicable). On-premises deployment on Base SAS, IBM SPSS Statistics, Minitab, and OriginPro keeps data inside the organization's network. SAS Viya, Posit Team, and Qualtrics Market Research add cloud-native deployment with enterprise governance, lineage tracking, and audit trails for regulated workflows.
SAS Viya leads on breadth, covering descriptive statistics, hypothesis testing, regression, machine learning, time series, and AutoML for automated model selection in a single platform. IBM SPSS Statistics covers the full classical statistics range (regression, ANOVA, MANOVA, survival analysis, factor analysis) through menu-driven workflows. Posit Team is the most flexible for teams building custom models in R or Python, and OriginPro is the most-cited platform for specialized scientific testing (peak fitting, curve fitting, signal processing).
For research workflows, descriptive statistics, ANOVA, regression, and survival analysis are the foundation, with IBM SPSS Statistics and Base SAS covering all four through validated procedures. For business intelligence and applied analytics, predictive modeling (regression, classification, clustering), time series analysis, and AI-assisted automation matter more, with SAS Viya and Posit Team leading on the predictive side.
SAS Viya is the strongest performer at enterprise scale, with cloud-native architecture that handles large datasets without local-machine constraints. Posit Team handles large datasets well when paired with distributed processing platforms like Databricks or Snowflake, the common pattern for the heaviest workloads. IBM SPSS Statistics slows noticeably with very large datasets, a known limitation that most academic and research workloads avoid in practice.
Base SAS, SAS Viya, and IBM SPSS Statistics lead on statistical rigor for regulated and academic workflows, with validated procedures accepted by FDA reviewers and journal editors. Base SAS scores 95% on Quality Control (the highest in the category), and IBM SPSS holds 91% ANOVA Support and 93% Regression scores. For research publishing, OriginPro's curve fitting and nonlinear models are the most-cited for accuracy, and Posit Team's reproducibility features protect against subtle errors from package-version drift.
The best statistical analysis software is the one that fits the way your team actually works. If you need cloud-native enterprise analytics with explainable AI, SAS Viya is the most complete platform in this list. If you're running social sciences or academic research and want menu-driven access to advanced procedures, IBM SPSS Statistics remains the most accessible choice.
If you're driving Six Sigma, DOE, and quality improvement work in manufacturing, automotive, or medical devices, Minitab Statistical Software is purpose-built and deploys fastest. If your workflow depends on the SAS ecosystem and regulator-accepted output, Base SAS is the trusted choice for clinical and financial submissions. If you're scaling R and Python data science at the enterprise, Posit Team layers governance and reproducibility on the open-source foundation.
If you're prototyping machine learning without coding, Orange is free and surprisingly capable. If survey research is at the center of your analysis, Qualtrics Market Research keeps the full lifecycle in one platform. And if you're working in a laboratory or engineering context where curve fitting and publication-quality plots matter, OriginPro is built for exactly that workflow.
The choice has never been broader. With the right tool, you can focus less on the technical side and more on making sense of the numbers to uncover the insights that matter.
Not sure how to maintain strong datasets? Learn the best practices to organize your data.


Modern technologies shape the era we live in. Among these paradigm-shifting technologies,...
 by Sagar Joshi

When you need an answer and need it fast, wouldn’t it be nice to ask everyone in the world who...
 by Mara Calvello

In modern organizations, decisions are rarely made without data. But raw numbers are just the...
by Sudipto Paul