

We’re all guilty of jumping to conclusions from time to time.
Whether it's convincing yourself that no one is going to buy a ticket for the conference you’ve worked so hard to plan or that arriving at the airport two hours in advance simply isn’t enough time, we’ve all done it.
Outside of our daily lives, it’s easy to jump to inaccurate conclusions at work, no matter the industry. When we do this, we’re essentially generalizing, but what if you could make these generalizations more accurately? It’s possible when you run inferential analysis tests.
Inferential analysis is used to draw and measure the reliability of conclusions about a population that is based on information gathered from a sample of the population. Since inferential analysis doesn’t sample everyone in a population, the results will always contain some level of uncertainty.
When diving into statistical analysis, oftentimes the size of the population we’re looking to analyze is too large, making it impossible to study everyone. In these cases, data is collected using random samples of individuals within a specific population. Then, inferential analysis is used on the data to come to conclusions about the overall population.
Because it’s often impossible to measure an entire population of people, inferential analysis relies on gathering data from a sample of individuals within the population. Essentially, inferential analysis is used to try to infer from a sample of data what the population might think or show.
There are two main ways of going about this:
In estimating parameters, the sample is used to estimate a value that describes the entire population, in addition to a confidence interval. Then, the estimate is created.
In hypothesis testing, data is used to determine if it is strong enough to support or reject an assumption.
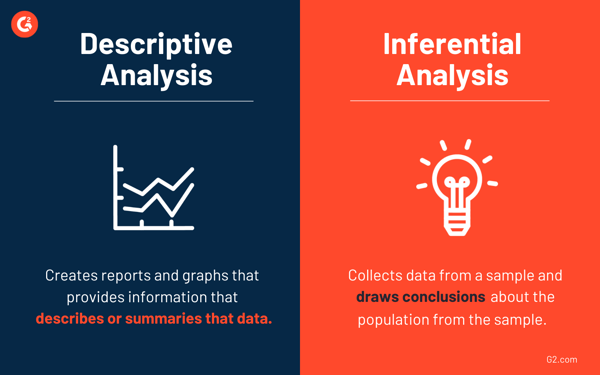
The two main types of statistical analysis that people use most often are descriptive analysis and inferential analysis. Because of this, it’s not uncommon for the two to be confused for each other, even though they provide data analysts with different insights into the data that is collected.
While one can’t show the whole picture, when used together, they provide a powerful tool into data visualization and prediction analytics, since they rely on the same set of data.
Descriptive statistical analysis gives information that describes the data in some way. This is sometimes done with charts and graphs made with data visualization software to explain what the data presents. This method of statistical analysis isn’t used to draw conclusions, only to summarize the information.
Inferential statistical analysis is the method that will be used to draw the conclusions. It allows users to infer or conclude trends about a larger population based on the samples that are analyzed. Basically, it takes data from a sample and then makes conclusions about a larger population or group.
This type of statistical analysis is often used to study the relationship between variables within a sample, allowing for conclusions and generalizations that accurately represent the population. And unlike descriptive analysis, businesses can test a hypothesis and come up with various conclusions from this data.
Let’s think of it this way. You’re at a baseball game and ask a sample of 100 fans if they like hotdogs. You could make a bar graph of yes or no answers, which would be descriptive analysis. Or you could use your research to conclude that 93% of the population (all baseball fans in all the baseball stadiums) like hotdogs, which would be inferential analysis.
There are many types of inferential analysis tests that are in the statistics field. Which one you choose to use will depend on your sample size, hypothesis you’re trying to solve, and the size of the population being tested.
Linear regression analysis is used to understand the relationship between two variables (X and Y) in a data set as a way to estimate the unknown variable to make future projections on events and goals.
The main objective of regression analysis is to estimate the values of a random variable (Z) based on the values of your known (or fixed) variables (X and Y). This is typically represented by a scatter plot, like the one below.
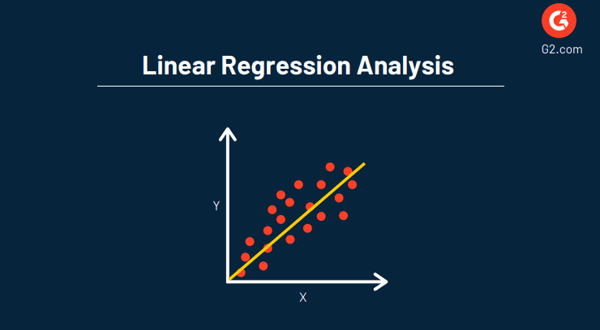
One key advantage of using regression within your analysis is that it provides a detailed look at data and includes an equation that can be used for predictive analytics and optimizing data in the future.
Y = a + b(x)
A → refers to the y-intercept, the value of y when x = 0
B → refers to the slope, or rise over run
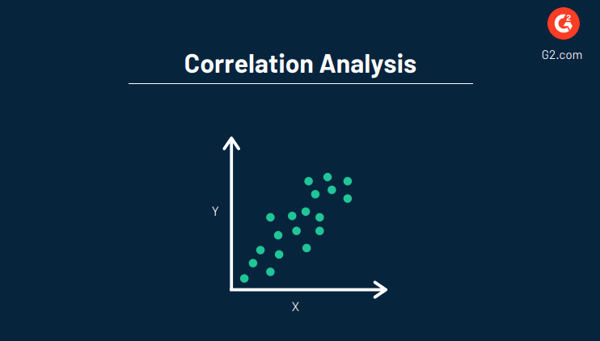
Another inferential analysis test is correlation analysis, which is used to understand the extent to which two variables are dependent on one another. This analysis essentially tests the strength of the relationship between two variables, and if their correlation is strong or weak.
The correlation between two variables can also be negative or positive, depending on the variables. Variables are considered “uncorrelated” when a change in one does not affect the other.
An example of this would be price and demand. This is because an increase in demand causes a corresponding increase in price. The price would increase because more consumers want something and are willing to pay more for it.
Overall, the objective of correlation analysis is to find the numerical value that shows the relationship between the two variables and how they move together. Like regression, this is typically done by utilizing data visualization software to create a graph.
Related: Learn more about the ins and outs of correlations vs regression, including the differences and which method your business should be using.
The analysis of variance (ANOVA) statistical method is used to test and analyze the differences between two or more means from a data set. This is done by examining the amount of variation between the samples.
In simplest terms, ANOVA provides a statistical test of whether two or more population means are equal, in addition to generalizing the t-test between two means.
Learn more: A t-test is used to show how significant the differences between two groups are. Essentially, it allows for the understanding of if differences (measured in means/averages) could have happened by chance.
This method will allow for the testing of groups to see if there’s a difference between them. For example, you may test students at two different high schools who take the same exam to see if one high school tests higher than the other.
ANOVA can also be broken down into two types:
A level is simply the different groups within the variable. So, using the same example as above, the levels of brands of peanut butter might be Jif, Skippy, or Peter Pan. The levels for calories could be smooth, creamy, or organic.
Analysis of covariance (ANCOVA) is a unique blend of analysis of variance (ANOVA) and regression. ANCOVA can show what additional information is available when considering one independent variable, or factor, at a time, without influencing others.
It is often used:
ANCOVA can also be used to pretest or posttest an analysis when regression to the mean will affect your posttest measurement of the statistic.
As an example, let’s say your business creates new pharmaceuticals for the public that lowers blood pressure. You may conduct a study that monitors four treatment groups and one control group.
If you use ANOVA, you’ll be able to tell if the treatment does, in fact, lower blood pressure. When you incorporate ANCOVA, you can control other factors that might influence the outcome, like family life, occupation, or other prescription drug use.
A confidence interval is a tool that is used in inferential analysis that estimates a parameter, usually the mean, of an entire population. Essentially, it’s how much uncertainty there is with any particular statistic and is typically used with a margin of error.
The confidence interval is expressed with a number that reflects how sure you are that the results of the survey or poll are what you’d expect if it were possible to survey the entire population.
For instance, if the results of a poll or survey have a 98% confidence interval, then this defines the range of values that you can be 98% certain contains the population mean. To come to this conclusion, three pieces of information are needed:
A chi-square test, otherwise known as an x2 test, is used to identify the difference between groups when all of the variables are nominal (also known as, a variable with values that don’t have a numerical value), like gender, salary gap, political affiliation, and so on.
These tests are typically used with specific contingency tables that group observations based on common characteristics.
Questions that the chi-square test could answer might be:
Usually, these tests are done using the statistical analysis method called simple random sampling to collect data from a specific sample to potentially come to an accurate conclusion. If we use the first question listed above, the data may look like:
| Name | Status | Education | |
| 1 | Melissa | Divorced | PhD or higher |
| 2 | Casey | Married | Bachelor's degree |
| 3 | Angela | Married | GED |
| 4 | Alyssa | Widowed | Bachelor's degree |
| 5 | Jenna | Never married | GED |
These contingency tables are used as a starting point to organize the data collected through simple random sampling.
There are many advantages to using inferential analysis, mainly that it provides a surplus of detailed information – much more than you’d have after running a descriptive analysis test.
This information provides researchers and analysts with comprehensive insights into relationships between two variables. It can also show awareness toward cause and effect and predictions regarding trends and patterns throughout industries.
Plus, since it is so widely used in the business world as well as academia, it’s a universally accepted method of statistical analysis.
When it comes to inferential statistics, there are two main limitations.
The first limitation comes from the fact that since the data being analyzed is from a population that hasn’t been fully measured, data analysts can’t ever be 100% sure that the statistics being calculated are correct. Since inferential analysis is based on the process of using values measured in a sample to conclude the values that would be measured from the total population, there will always be some level of uncertainty regarding the results.
The second limitation is that some inferential tests require the analyst or researcher to make an educated guess based on theories to run the tests. Similar to the first limitation, there will be uncertainty surrounding these guesses, which will also mean some repercussions on the reliability of the results of some statistical tests.
Before you jump to a potentially inaccurate conclusion regarding data, make sure to take advantage of the information that awaits within an inferential analysis test.
No matter the type of conclusion you’re looking to come to, or the hypothesis you start with, you may be surprised by the results an inferential analysis test can bring.
Looking for statistical analysis software to better interpret all of your data sets? Or maybe a tool that makes even the most complex statistical analysis simple and conclusive? Check out our list of unbiased reviews on G2!


Whether you do it subconsciously or on purpose, it’s human nature to put things into groups.
by Mara Calvello

If you are a software developer, marketer, or entrepreneur, you know how important it is to...
 by Jeremy Moser

In today's rapidly growing technological workspace, businesses have more data than ever before.
by Mara Calvello