

When I talk to DevOps and SRE teams, I hear the same frustration on loop: fragmented logs, missed alerts, and way too much time spent digging through noise instead of solving the actual issue. I’ve seen how quickly a small blind spot can snowball into a major outage, usually because logs lived in too many places or the alert stream was flooded with duplicates. It’s exactly why conversations about the best log monitoring software matter so much right now.
I’m not an engineer by training, but I research software for a living, and log monitoring is one category where the differences between tools really matter. The major question is often “which platform fits how your team works and the systems you’re responsible for?”
To answer that, I combined G2 Data (Grid® Reports, satisfaction scores, and review patterns) with my own research into how each tool handles ingestion, alerting, dashboards, and root-cause workflows. Some platforms make it easy to get visibility in minutes; others go deeper with correlation, anomaly detection, and analytics built for complex distributed environments.
If you’re ready to find the best log monitoring software that cuts noise and surfaces real issues faster, here are the six best log monitoring tools that stood out in my evaluation: Datadog, New Relic, Dynatrace, Better Stack, LogicMonitor, and Sumo Logic.
Read on to know why these log management tools made the cut.
*These log monitoring software are top-rated in their category, according to the G2 Fall Grid Report. The prices above reflect publicly listed starting rates for data ingestion under log analytics/management on the vendor pricing page. Actual cost varies by log retention, indexing/search needs, data region, billing term, etc. Please refer current pricing on the vendor’s site.
Here’s a quick comparison table that shows you how each platform performs across core capabilities like real-time monitoring, alerting, dashboards, automation, and reporting based on G2 feature ratings.
| Log monitoring software | Real-time monitoring | Dashboards & visualizations | Alerts & notifications | Automation | Reporting |
| Datadog | 91% | 90% | 91% | 85% | 90% |
| New Relic | 92% | 92% | 93% | 87% | 91% |
| Dynatrace | 93% | 91% | 90% | 90% | 87% |
| Better Stack | 94% | 94% | 92% | 88% | 92% |
| LogicMonitor | 90% | 86% | 91% | 81% | 84% |
| Sumo Logic | 86% | 85% | 84% | 78% | 85% |
Log monitoring software scans and monitors log files generated by servers, applications, and networks, and that’s what makes it so essential in fast-moving environments. These tools detect patterns, anomalies, and critical events that point to performance issues or security risks. In my research, I’ve seen how SREs, system admins, and security teams depend on these signals to catch problems early and avoid digging through thousands of lines of raw logs during an incident.
What separates the best platforms is how they turn all that log data into something you can actually act on. Centralized ingestion, noise-reducing alerting, cross-system correlation, and clean dashboards make it much easier to understand what’s happening across your stack. When these pieces work together, teams get better visibility, faster troubleshooting, and a more accountable operational workflow, not just more logs.
As I compared tools, the G2 Data I found reinforced what I was seeing: log monitoring platforms tend to deliver value quickly. The average payback period is about 13 months, adoption sits around 64%, and time-to-go-live ranges from just 0.1 to 3.4 months. Once a team centralizes its logs and automates the basics, the impact on incident response is almost immediate. That’s why the best log monitoring software is worth the investment.
I started with G2’s Grid Reports, the most reliable source I know for real, unbiased user feedback to narrow down a shortlist of top-rated analytics platforms, mixing both well-established leaders and high-growth challengers.
To layer in more context, I used AI tools to analyze hundreds of verified G2 reviews. That helped me spot consistent praise (like speed, ease of use, and support) and red flags (like limited customization or integration issues) across platforms.
I consulted a professional with hands-on experience of the tool, validating their insights with reviews from G2. The screenshots featured in this article are a mix of visuals taken from G2 vendor pages and publicly available product materials.
After digging into G2 Data and my own research, I noticed the same technical priorities coming up again and again. The tools that performed best are easy to use, and they delivered deeper visibility, faster query performance, and stronger end-to-end workflows that matter when you’re debugging real systems.
After evaluating 10+ platforms, I shortlisted the ones that consistently excelled where teams feel pain. I'd note here that not every tool in this list might be perfect in every technical area, and that’s normal. The best log monitoring software delivers where it counts for engineers: reliable ingestion, fast search, meaningful correlations, and workflows that shorten the path from alert to root cause.
The list below contains genuine user reviews from the Log Monitoring Software Category. To be included in this category, a solution must:
*This data was pulled from G2 in 2025. Some reviews may have been edited for clarity.
G2 rating: 4.4/5
Datadog is one of those tools that comes up almost immediately when I analyze the log monitoring space, and it’s easy to see why. It approaches logs as part of a unified observability workflow, not an isolated data stream, which matters a lot when you're juggling infrastructure, applications, and distributed services.
As I went through G2 reviews and product documentation, the theme was consistent: teams lean on Datadog because it brings together logs, metrics, traces, dashboards, and alerting in a way that feels cohesive rather than stitched together.
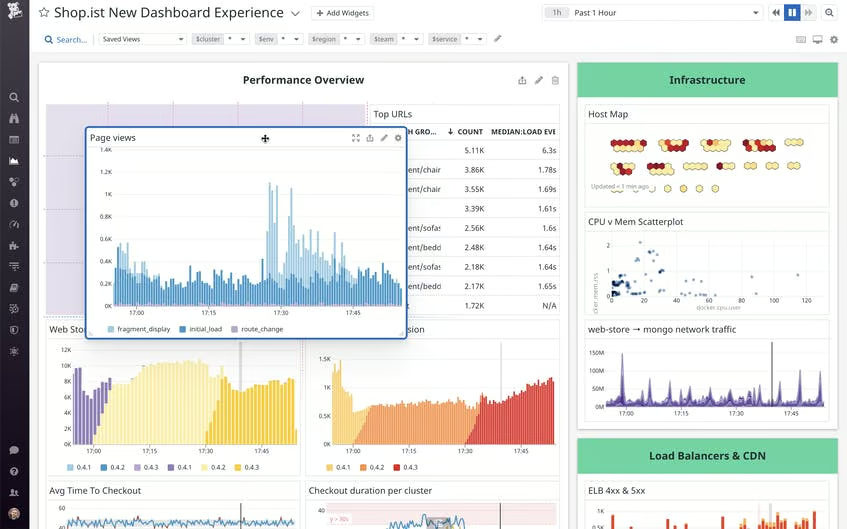
A lot of users call out how responsive the platform feels, even with massive amounts of data flowing in. That lines up with its highest-rated features on real-time monitoring, alerts and notifications, and dashboards and visualizations, the satisfaction scores of which all sit around the top end of the category.
The ability to ingest logs from hundreds of technologies, analyze them with Log Explorer, and pivot instantly to related traces or metrics is a huge efficiency boost. Reviewers also consistently highlight the flexibility to fine-tune custom metrics and control log ingestion costs, which is a big deal for teams handling millions of events per minute.
Datadog’s broad coverage consistently earns praise. People appreciate how easily it integrates with AWS, Azure, Kubernetes, databases, APIs, you name it. Several reviewers said implementation was straightforward. I also saw a lot of appreciation for the responsive support team, with users mentioning feature requests being implemented surprisingly quickly.
From what I gathered on G2, users really appreciate Datadog’s unified view. Being able to jump from logs to traces or dashboards instantly is a recurring theme in G2 reviews. Teams that want deeper or highly customized dashboards, though, might want to plan for some initial configuration time because a few reviewers noted that the interface can feel dense when you’re building advanced queries or complex monitors.
Another strong theme is how powerful Datadog’s ingestion and analytics features are at scale. At the same time, teams looking for very cost-predictable setups might want to keep a close eye on log volumes. Several reviewers mentioned that costs can rise quickly as ingestion grows or multiple modules are enabled. Datadog’s retention controls, Logging Without Limits™, and Flex Logs help teams manage this, but thoughtful planning goes a long way.
Pulling it all together, Datadog earns its reputation as one of the best log monitoring software options available. In my view, it’s a powerful fit for engineering teams that want unified observability, fast query performance, seamless correlation across signals, and a platform that scales with high-volume, high-velocity environments.
"Datadog provides an excellent all-in-one monitoring solution that gives complete visibility into infrastructure, applications, and logs. The customizable dashboards make it easy to track performance metrics in real time, and the alerting system ensures quick detection of issues. Its wide range of integrations with cloud services, databases, and tools makes it very flexible. The user interface is intuitive and easy to navigate, even for new users."
- Datadog review, Navojith Shankar G.
"Datadog can get expensive as usage scales, especially with multiple integrations and high data ingestion. The pricing model isn't always transparent, and configuring some advanced features can be a bit complex without strong technical knowledge or documentation."
- Datadog review, Royal G.
Monitoring helps detect issues, but continuous delivery helps prevent them in the first place. Explore the best continuous delivery tools that streamline deployments and reduce production risks.
G2 rating: 4.4/5
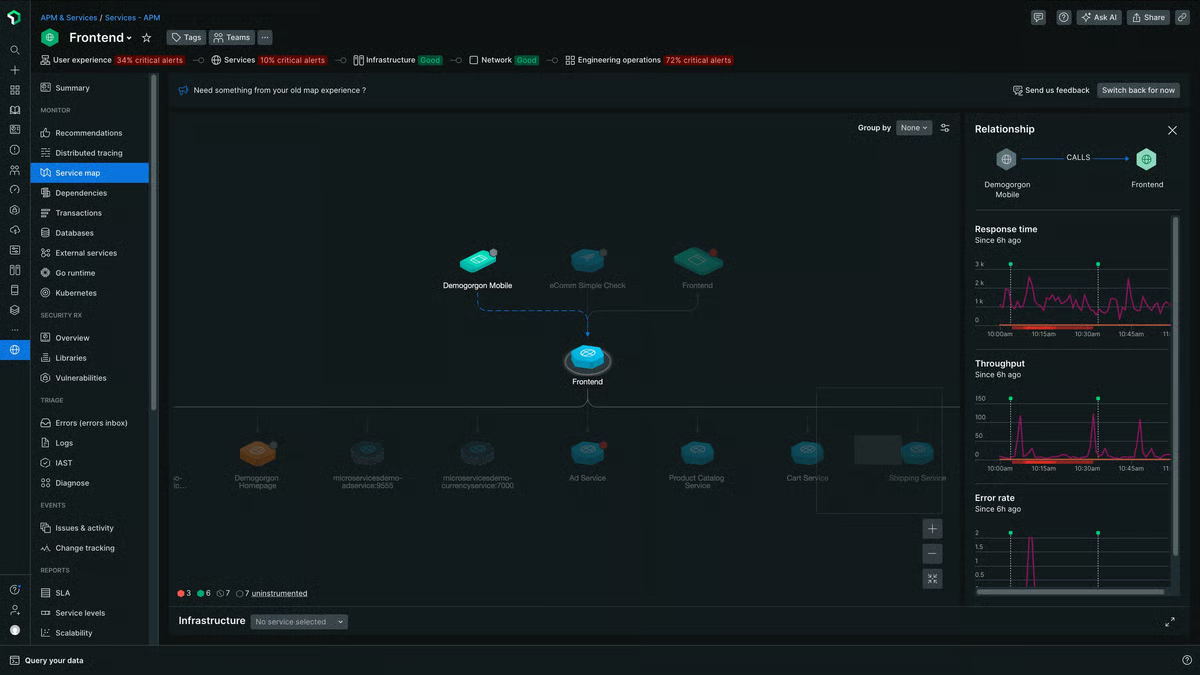
New Relic is a well-known cloud-based observability and monitoring platform aimed at helping software/DevOps/engineering teams monitor applications, infrastructure, logs, metrics, traces, and more in real time.
As I dug through G2 reviews and product material, a clear pattern emerged. It's often the go-to choice for teams that want deep performance analytics, rich APM visibility, and fast ways to pinpoint where a slowdown or error actually began. Instead of piecing together clues across tools, reviewers talk about how New Relic helps them trace issues across APIs, backend services, databases, and user interactions in a way that feels intuitive once you get the hang of it.
On the practical side, users can get logs flowing using New Relic’s forwarder, guided install, or open-source agents like Fluent Bit and Logstash.
Users talk about spotting slow APIs, debugging complex flows, and getting detailed transaction traces without any extra effort. The AI-assisted features, like log summarization and faster root-cause hypotheses, are also a plus, especially for teams trying to reduce MTTR.
Reviewers also mention the platform’s real-time monitoring and deep APM visibility. That aligns perfectly with its top-rated features on G2: alerts and notifications, dashboards and visualizations, and real-time monitoring all sit above the category average.
On the whole, reviewers really value New Relic’s depth. That depth is also why teams looking for a very simple, lightweight experience might want to plan for a bit of onboarding time. Even though the setup itself is straightforward, some users mention that dashboards, NRQL queries, and advanced traces can feel complex at first, especially for teams new to full-stack observability
Another theme I noticed is how much people appreciate New Relic’s ability to scale and handle large volumes of telemetry. At the same time, teams that need highly predictable costs may want to think through their ingestion patterns early. Because pricing is usage-based, reviewers say costs can rise as log, trace, or seat volumes grow, so planning retention and data routing upfront tends to help.
My takeaway is that New Relic is a great fit for teams that want deep visibility into how their applications behave under real conditions, not just a place to store logs.I’d especially recommend it for engineering and SRE teams running complex, distributed environments who want strong APM insight paired with responsive log search
"New Relic provides a very detailed and intuitive observability platform. The real-time performance monitoring, distributed tracing, and powerful dashboards make it easy to identify bottlenecks quickly. I especially like how seamlessly it integrates with multiple tech stacks — from mobile apps to backend services — and how the alerting system helps catch production issues before they impact users. The UI is clean, data visualization is excellent, and the query-based insights (NRQL) give a lot of flexibility for deeper analysis."
- New Relic review, Tejas R.
"The platform has a learning curve, especially when using advanced features like distributed tracing and custom dashboards, which can require additional training for new users. The pricing model is sometimes confusing, with separate charges for different modules and data limits, so it’s important to monitor usage and understand the billing details. Documentation updates can lag behind new feature releases, leading to occasional onboarding challenges."
- New Relic review, Anupam J.
If your team handles on-call rotations or production incidents, the G2 Incident Response category is worth looking at alongside log monitoring tools.
G2 rating: 4.5/5
Dynatrace is the kind of platform I kept seeing whenever I looked at teams running complex, high-stakes systems. Financial services, insurance, healthcare, and large software companies show up a lot in its G2 reviews.
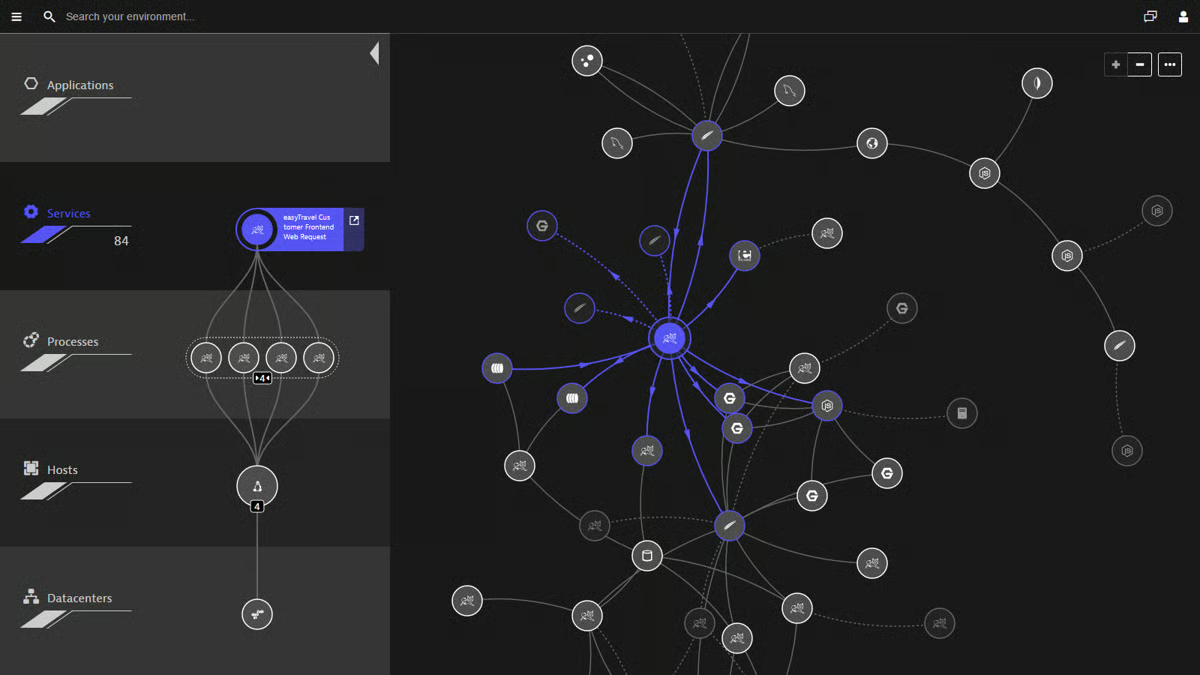
From what I’ve analyzed, it’s positioned less as a simple log viewer and more as an “all-in” observability layer where logs, metrics, traces, user sessions, and Davis AI all work together to explain why something is happening in production. For log monitoring specifically, teams talk about being able to pull logs from many different systems into one place and then use problem workspaces, code-level traces, and AI insights to move very quickly from signal to root cause.
What stood out first in the data is how often people mention the combination of OneAgent and Davis AI. Reviewers like that deployment is usually a one-time agent install, followed by automatic discovery of services and dependencies, which makes it easier to get dashboards and alerts running without a ton of manual wiring.
Davis AI is a recurring theme: users say it pinpoints root causes automatically, correlates events across the stack, and catches anomalies before customers feel them. That aligns nicely with Dynatrace’s highest-rated features on G2, namely, real-time monitoring at 93%, dashboards and visualizations at 91%, and performance baseline at 90%, all above the category averages, plus strong satisfaction scores for quality of support, ease of admin, and ease of doing business with.
From a log perspective, I saw a lot of comments about “one stop shop” visibility. Teams use Dynatrace to trace logs across services, drill into problem workspaces, and connect what they see in dashboards directly to the underlying infrastructure or code path.
That’s especially valuable in the industries that dominate its review base (computer software, IT services, and financial services), where outages can be expensive and regulatory pressure is real. Several reviewers also call out how helpful session replay and real user monitoring are when they’re trying to understand what a customer actually did before an error or slowdown, instead of just staring at log lines.
Because of that depth, some teams mention that it takes effort to navigate everything the platform offers. Some reviewers who praise the richness of dashboards, DQL, and AI-driven analytics also note that teams wanting something extremely lightweight and minimal may want to plan time for training and onboarding. There’s a lot of capability packed into one place, and getting developers comfortable with the full feature set can take some deliberate enablement.
Many customers clearly feel they’re getting strong value, especially when Dynatrace helps them reduce downtime and MTTR, but organizations with tight budgets or nonprofit constraints mention that they need to govern licensing and consumption carefully. For teams that prioritize strict cost predictability above advanced analytics and AI, it’s worth going in with a clear sizing model and some guardrails on what gets instrumented first. And to be fair, all these are some considerations that users share across different tools mentioned here, from Datadog to Dynatrace.
Based on that data and everything I’ve read, I see Dynatrace as a top choice for enterprises and regulated industries that want AI-assisted, full-stack observability and are ready to centralize logs, traces, and performance data in one powerful platform. It is also one of the best IT alerting software for enterprises.
"Dynatrace’s Davis AI engine automatically pinpoints the root cause of issues, which saves huge time compared to manual troubleshooting. Dynatrace continuously monitors without gaps, so performance bottlenecks and anomalies are detected instantly."
- Dynatrace review, Sandeep M.
"It's quite tough to learn and understand how to use the tool. Basically, the learning curve is high. It’s pretty expensive. And if not configured correctly, you will bleed money. Just due to the learning curve, we found the frequency of users using the app going down."
- Dynatrace review, Sunil A.
All three platforms excel for log monitoring, but they fit different team needs. So, the "better" platform depends on specific needs.
Want more details before you take a call? Compare ratings for different features of Datadog, New Relic, and Dynatrace based on 1,000+ user reviews.
G2 rating: 4.8/5
Better Stack is the tool I keep seeing praised by developers who just want their logs, uptime checks, and incidents in one clean place without wrestling with a heavy enterprise platform. As I went through G2 reviews and product details, the pattern was clear: it’s positioned as a modern, developer-friendly logging and monitoring stack with a very polished UI, quick setup, and a generous free tier that’s especially appealing for side projects, startups, and smaller SaaS teams.
Ease of use is the big story here. Reviewers repeatedly mention that onboarding takes minutes, not days; if you already have logs, wiring them into Better Stack is described as almost trivial. That’s backed up by the G2 satisfaction data, where Ease of Use and Ease of Setup both sit at 97%, well above category averages.
Real-time monitoring, dashboards, and performance baselines all score around 94%, which lines up with comments about lightning fast logs, structured logging that’s easy to query, and dashboards that feel clean rather than cluttered. I also saw a lot of love for having monitors, heartbeats, log telemetry, and even public status pages in one place, with teams in software, IT services, and security especially calling out how helpful that is for incident response.
Support and overall experience come up a lot as positives, too. Users talk about responsive, diligent support that fixes billing or configuration issues quickly, and several reviews read almost like thank-you notes to the product team.
People appreciate touches like autofilling config snippets in the docs, Playwright integration for synthetic checks, and the ability to send alerts straight into Slack or other collaboration tools, small things that make the platform feel tuned to fast-moving engineering teams.
Overall, users really like the core experience. Based on G2 reviews, teams wanting deeper control, like richer status-page customization, more flexible alert thresholds, broader coverage, or stronger authentication options, might look for more advanced features as their needs grow. Second, while many reviewers praise that Better Stack works well for small to mid-sized teams, users may want to plan for higher pricing tiers as log volumes grow, more monitors are added, or advanced integrations become necessary.
All things considered, Better Stack stands out as one of the best log monitoring software choices for teams that value a developer-friendly workflow. I’d recommend it for startups, SaaS teams, and engineering groups that want real-time log visibility and integrated uptime monitoring without the complexity of a heavyweight enterprise platform.
"I greatly appreciate the independence of Better Stack, which ensures that I receive notifications even when my VPS and hosting servers are down, as it continues to operate and alert me of any issues. The program's clear user interface is another standout feature, enabling me to configure everything effortlessly without having to delve into extensive documentation. It's incredibly intuitive and efficient.
The instant notifications are vital for me because they allow me to react immediately to any downtime and handle incidents promptly. The status pages are also quite beneficial, as they let me continuously monitor the status of my services. Also, I found the initial setup process to be straightforward and easy, which was a great plus for me."
- Better Stack review, Tymoteusz J.
"There’s not much to dislike, but I’d love to see even more native SDKs or Symfony-specific integrations to speed up setup even further. Also, some of the more advanced features are understandably behind the paid tier, which can be limiting once your project grows — but that’s fair for a product this well-built."
- Better Stack review, Alex H
G2 rating: 4.5/5
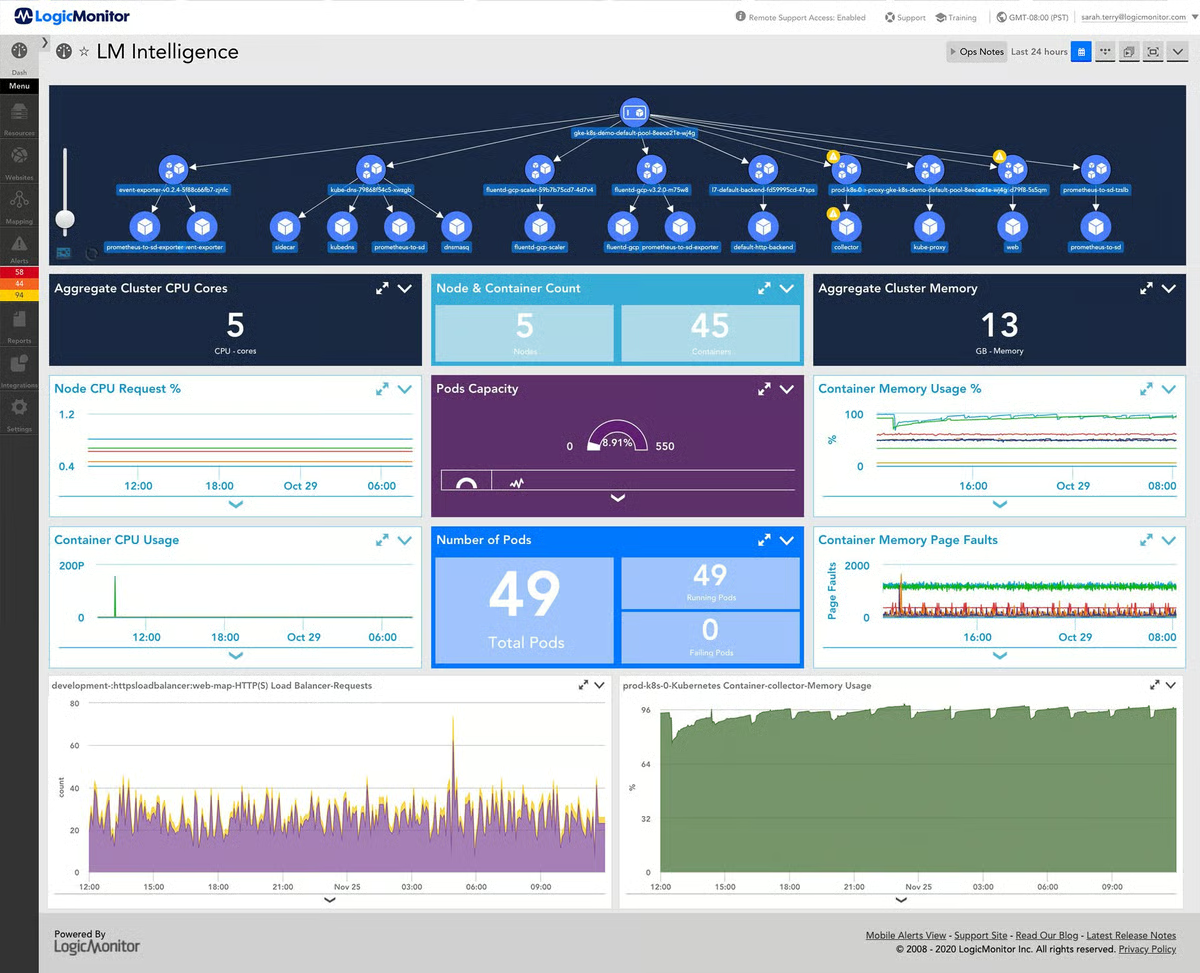
LogicMonitor kept showing up in my analysis as the tool teams turn to when they need deep, infrastructure-heavy visibility, especially MSPs, IT services, and larger enterprises.
As I read through G2 reviews and product material, the pattern was clear: LogicMonitor positions itself as a broad, infrastructure-first observability platform that pulls logs, metrics, device data, cloud telemetry, and network signals into one place. For teams managing hybrid or multi-tenant environments, that kind of breadth matters.
A lot of reviewers talk about how powerful the platform feels once it’s up and running. People consistently mention strong end-to-end visibility, granular metrics, historical graphs, and AI-driven insights that reduce noise and highlight what needs attention. That lines up with its highest-rated G2 features, such as real-time monitoring (94%), dashboards and visualizations (94%), and performance baseline (92%), all above the category average.
Teams in software, IT services, and financial services especially call out how useful it is to trace issues across customer environments, correlate device health, and rely on the platform daily for NOC-style operations. Several reviewers also praise how flexible the data sources and integrations are, noting how easy it is to tie LogicMonitor into systems like ServiceNow, PagerDuty, Azure, AWS, and custom tooling through the API.
Support also shows up often as a strength. Users appreciate quick responses, helpful onboarding, and the ability to customize dashboards, alerts, and monitors to match their environment. Many mention that once the initial setup is done, LogicMonitor is stable, low-maintenance, and becomes part of their daily workflow.
Because the platform is powerful, some reviewers note that the UI can feel busy at first, and teams might want to spend some time getting used to it. Others mention that the breadth of data and configuration options means it can feel overwhelming until you learn where everything lives.
Another theme is around customization and scale. Many users highlight LogicMonitor’s flexibility, and at the same time, teams that want predictable licensing or out-of-the-box integrations for every scenario might plan ahead.
Based on everything I analyzed, LogicMonitor stands out as one of the best log monitoring software picks for organizations that manage complex infrastructures and need deep, cross-system visibility. I’d recommend it especially for MSPs, IT operations teams, and enterprises running hybrid environments who want strong alerting, rich device insights, and consistent performance across large deployments.
LogicMonitor is a comprehensive visibility and automation for IT infrastructure monitoring. The platform gives a unified view across cloud, on-premises, and hybrid environments, which makes troubleshooting much faster. Its intelligent alerting system reduces noise by focusing on actionable insights rather than flooding you with notifications. Overall, LogicMonitor strikes a great balance between powerful analytics and user-friendly design, making infrastructure monitoring both efficient and proactive."
- LogicMonitor review, Praveen Kumar M.
"Not every built-in integration is particularly useful, so we have written our own on occasion. There are a few things within the platform that don't perfectly fit our needs and have required workarounds. Some features are only available in one version of the UI or the other. Individual licenses are expensive, relatively speaking, and cheaper license options like the website monitors for internal or external ping checks are somewhat unintuitive. It can be time-consuming to determine which alerts are actionable and which are noise, and to tune the thresholds appropriately."
- LogicMonitor review, Wiren D
Explore G2's complete guide to EDR tools that can help with endpoint monitoring, detection, and response at scale.
G2 rating: 4.3/5
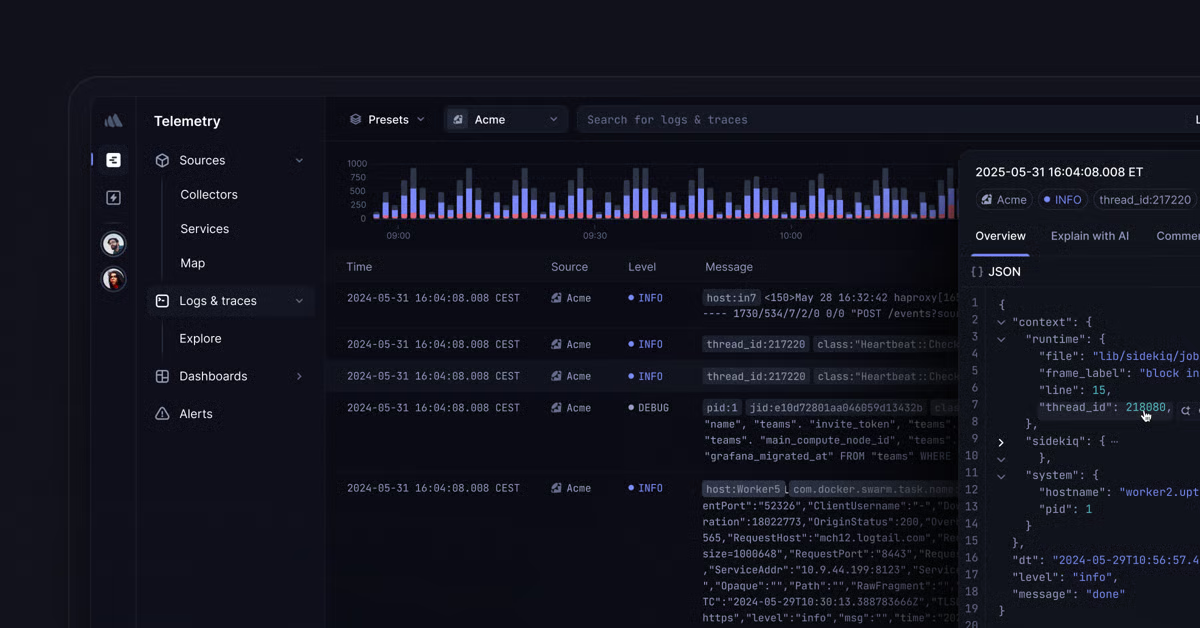
Sumo Logic is a cloud-native SaaS platform focused on log analytics, infrastructure/application observability, and security operations, and from my research, I found that it's ideal for mid-sized and growing teams that are at the “scale or complexity” stage.
Teams value how quickly Sumo Logic lets them sift through massive log volumes, validate deployments, and catch anomalies before they turn into incidents. That fits well with its highest-rated features on G2: real-time monitoring and reporting, both in the mid-80s and sitting close to category averages.
Most reviewers come from IT services, software, and financial services, which makes sense given how often they mention multi-environment troubleshooting and security workflows.
A lot of users call out how effective the search experience is. People say queries return fast results, the syntax is flexible but approachable, and the platform makes it easy to pivot from high-level dashboards into detailed root-cause investigations. Reviewers also highlight the value of machine learning for anomaly detection, especially when validating CI/CD deployments or watching for regressions in production.
Prebuilt dashboards for AWS, Kubernetes, and other cloud tools also get consistent praise. Teams can start monitoring without building everything from scratch. And across many reviews, I saw mentions of how well Sumo Logic scales with large log volumes and how seamlessly it integrates with existing systems.
Many reviewers appreciate how powerful Sumo Logic becomes once you learn your way around its query language, and teams wanting a more guided or beginner-friendly experience might find that advanced queries, joins, and ML-driven analytics take some ramp-up time before they feel fully natural.
Users consistently note that Sumo Logic handles real-time searches well, and teams working with very large dashboards or deep historical queries might see a slightly slower load times during heavy workloads, especially if they expect a more modern or high-polish interface.
On the whole, I’d recommend it for cloud-centric engineering teams, security operations, and organizations looking for a log analytics platform that blends real-time monitoring with flexible, powerful querying.
"Runtime calculated fields are incredible. Unlike Datadog (where calculated fields must be defined at ingestion time), Sumo Logic lets you define them on the fly. This is a massive productivity boost when you’re iterating on queries or exploring new log patterns. Outstanding value. Hosting my entire company’s logs cost roughly $100/month, which is shockingly affordable compared to Datadog or similar platforms. Easy integration with Heroku. The setup was quick and straightforward—no complex pipelines or custom agents required. Powerful search and flexibility. Once you get comfortable with its syntax, the query language is expressive and great for digging deep into logs."
- Sumo Logic review, Johnny M.
"Sometimes the learning curve for writing more advanced queries or joins can be steep for new team members. Also, when queries are very complex, they can take a bit longer to execute. A bit more guidance or templates for common troubleshooting use cases would be helpful."
- Sumo Logic review, Rishabh S.
Got more questions? G2 has the answers!
For organizations that need truly centralized visibility, Datadog, Dynatrace, and LogicMonitor stand out. Datadog offers unified logs, metrics, and traces in one place, making cross-system correlation fast. Dynatrace’s automation and topology mapping help teams understand the context of every log event. LogicMonitor delivers strong infrastructure-centric visibility that’s ideal for hybrid and multi-site environments.
SMBs usually balance cost with ease of use, making New Relic, Sumo Logic, and Better Stack strong fits. New Relic provides a generous all-in-one observability model, Sumo Logic offers scalable ingestion tiers, and Better Stack is known for budget-friendly pricing with clean dashboards and fast alerting.
For large and complex environments, Dynatrace, Datadog, and LogicMonitor are consistently favored. Dynatrace excels with AI-driven analysis and full-stack coverage, Datadog offers unmatched cloud-native ecosystem support, and LogicMonitor delivers deep hybrid infrastructure visibility with high reliability.
If you rely heavily on incident response workflows, Datadog and Sumo Logic integrate tightly with platforms like PagerDuty, Opsgenie, Jira, and ServiceNow. These tools support bidirectional workflows, automated alert routing, and smart escalation policies, making IR processes smoother and more repeatable.
Dynatrace is widely recognized for advanced anomaly detection powered by its Davis AI engine, which analyzes relationships across logs, metrics, and services. Datadog and Sumo Logic also deliver strong machine-learning-based anomaly insights, helping teams detect unusual behavior before it impacts customers.
When speed matters, Datadog and Better Stack are top choices. Datadog provides real-time alerts triggered by streaming log ingestion, while Better Stack is optimized for minimal latency, offering instant notifications and highly reliable incident routing—particularly useful for smaller engineering teams.
Organizations in healthcare, finance, or government often choose LogicMonitor, Dynatrace, or Sumo Logic. These tools support audit logging, long-term retention, encryption, role-based access control, and compliance frameworks such as HIPAA, PCI-DSS, SOX, and ISO 27001. Each vendor offers documentation and built-in controls tailored to regulatory requirements.
If customization is critical, New Relic, Datadog, and LogicMonitor offer flexible dashboards that can be tailored to any environment. New Relic is known for its multi-source visualizations, Datadog offers extensive widgets and template variables, and LogicMonitor makes it easy to build role-specific dashboards for IT, DevOps, and security teams.
For cloud-native teams, Datadog, Dynatrace, and Sumo Logic support real-time log ingestion across AWS, Azure, and Google Cloud platforms. They integrate directly with cloud logging pipelines, serverless workloads, and containerized environments to deliver near-instant insights.
If security is the top priority, Dynatrace, LogicMonitor, and Sumo Logic stand out for their advanced retention controls, encryption at rest and in transit, detailed RBAC policies, and SIEM-ready integrations. These tools also support alerting tied to suspicious log patterns, helping security teams act faster.
Key features include real-time ingestion, automated alerting, anomaly detection, search and filtering, long-term retention, dashboard customization, SIEM or APM integrations, and multi-cloud support. Many teams also look for correlation capabilities between logs, metrics, and traces, which tools like Datadog, Dynatrace, and New Relic excel at.
Yes. Popular open-source log monitoring tools include the ELK/OpenSearch Stack, Graylog, Grafana Loki, and SigNoz, which support log collection, analysis, and visualization and integrate with tools like Fluentd, Prometheus, and Grafana.
That said, many teams prefer paid log monitoring tools for easier setup, built-in scalability, enterprise-grade security, dedicated support, and advanced features like AI-driven alerts, long-term retention, and compliance reporting—especially as environments grow more complex.
Pricing varies significantly depending on ingestion volume, retention needs, and licensing. Tools like Better Stack and New Relic offer SMB-friendly plans, while enterprise-grade platforms such as Dynatrace and LogicMonitor follow usage-based or host-based models. Overall costs can range from low monthly spend for small teams to large annual contracts for global enterprises.
Absolutely. Log monitoring reduces MTTR by centralizing visibility, enabling correlation between services, and providing faster detection of anomalies or failures. Tools like Datadog and Dynatrace surface root-cause insights automatically, while Sumo Logic and LogicMonitor make it easy to trace issues across infrastructure and applications.
While Datadog, New Relic, Dynatrace, LogicMonitor, Sumo Logic, and Better Stack cover most needs, some teams may also evaluate tools like Splunk, Grafana Loki, Graylog, or Coralogix. These alternatives offer strong search performance, open-source flexibility, or specialized log analytics capabilities, depending on your environment.
After comparing these six platforms side by side, the biggest insight I walked away with is how differently teams define “good” log monitoring depending on the architecture they’re running. What really surprised me is how clearly the G2 reviews mirrored those realities: cloud-native teams rave about speed and correlation, enterprise teams care about AI and depth, and growing teams want visibility without the overhead of a massive rollout. The feature sheets don’t tell you that — the user feedback does.
The more I dug in, the more it became obvious that log monitoring isn’t really about logs at all. It’s about shortening the space between something just broke and we know exactly why. Every tool in this list solves that problem in its own way: some with automation, some with clean UIs, some with fast search, and some with sheer ecosystem reach. The trick is matching your tool to the shape of your system, not the other way around.
If I had to leave you with one takeaway, it’s this: pick the platform that reflects how your team actually works during an incident — the one that helps you move from noise to clarity the fastest. That’s ultimately what makes a log monitoring tool worth it.
If you’re exploring log monitoring for security use cases, check out the G2 SIEM Platforms category to compare the top tools side by side.


Application Performance Management (APM)
I’m no stranger to applications crashing, freezing, or throwing errors at the worst possible...
 by Harshita Tewari

Picking the right one from the best AIOps tools in the market directly affects how quickly...
 by Disha G

I’ve spent the last three years writing about IT and cloud security, talking to DevOps teams,...
by Soundarya Jayaraman