

I’ve spent the last three years writing about IT and cloud security, talking to DevOps teams, IT admins, and security pros about their biggest cloud headaches. One thing is clear: managing cloud infrastructure without the right cloud monitoring tools is like flying blind.
I’ve heard stories of teams scrambling to diagnose downtime, dealing with endless alerts that lead nowhere, and struggling with surprise cloud bills. If you’re here, you’re probably facing the same issues. You need a cloud infrastructure monitoring software that doesn’t just flood you with data but helps you take action before things break.
Whether you’re a founder hunting for the best cloud infrastructure monitoring software for tech startups or an IT lead at a mid-market company trying to control costs, the right platform can make the difference between smooth operations and endless firefighting.
So, I did what I do best. I researched. I talked to the people who rely on these tools the most: cloud engineers, DevOps teams, and security professionals. I also dug into dozens of G2 reviews to get a data-backed picture of how these tools perform in real-world environments.
Whether you’re trying to prevent outages, optimize performance and costs, or strengthen security, I’ve researched 30+ tools to find the five best cloud monitoring tools for 2026. These are IBM Instana, Datadog, Dynatrace, New Relic, and Site 24x7.
*These are the top-rated products in the cloud infrastructure monitoring software category, according to G2 Grid Reports. I have mentioned the starting price of their paid plans for cloud infrastructure monitoring for easy comparison.
If people ask me, “What exactly do cloud monitoring tools do?” I like to keep it simple: they give you a real-time window into your cloud environment, so you’re not flying blind.
From my conversations with IT admins and DevOps teams, I’ve learned that cloud monitoring is all about visibility and control. You don’t just want raw data. You need insights that actually help you take action before issues spiral into full-blown outages.
According to recent industry research, the global cloud monitoring market was valued at around $2.96 billion in 2024 and is projected to grow to $9.37 billion by 2030. That growth reflects how mission-critical monitoring has become as businesses scale apps, adopt multi-cloud, and try to stay ahead of performance, security, and cost challenges.
And G2 Data shows that the average estimated ROI for cloud infrastructure monitoring tools is about 11 months, which is why choosing the right tool now matters.
Finding the best cloud monitoring tools isn’t just about comparing features. It’s about what actually works in real-world environments. I started by analyzing G2 Grid reports to see cloud infrastructure monitoring software with the best reviews to create a shortlist of 30+ tools.
To go beyond rankings, I used AI to analyze hundreds of G2 user reviews. This helped me spot recurring issues like noisy alerts, complex setups, and gaps in multi-cloud support. I also spoke with IT admins, DevOps teams, and cloud engineers to understand what they rely on daily. Their insights helped me focus on solutions that provide real-time observability, proactive issue detection, and seamless integrations with cloud-native environments.
In cases where I couldn’t use the tool, I teamed up with market research analysts and IT experts who have first-hand experience and validated their insights using verified reviews on G2.
Combining G2 reports, AI insights, and inputs for other users, I found the top cloud monitoring tools that offer real visibility, proactive issue detection, and seamless integration.
The screenshots featured in this article may be a mix of those captured during research from publicly available material and those obtained from the vendor’s G2 page.
To separate the best service for real-time cloud monitoring, I focused on patterns in reviews that highlight what matters in effective, reliable, and scalable cloud monitoring platforms.
With this in mind, I evaluated 30+ cloud infrastructure monitoring solutions and found the 5 best cloud infrastructure monitoring software according to IT pros that ticked off most of the boxes. While they might not be perfect in every sense, they bring some unique strengths to the table.
The list below contains genuine user reviews from the cloud infrastructure monitoring software category. To be included in this category, a solution must:
From what I learned, IBM Instana has a solid reputation as a real-time observability and application performance monitoring tool for modern hybrid and multicloud environments. According to G2 Data, this cloud infrastructure monitoring platform is used by 44% mid-market teams and 38% enterprises.
IBM Instana stands out for its simple deployment and low setup overhead. According to G2 reviews, teams appreciate that a single Instana agent can automatically discover services, APIs, databases, and infrastructure components across the stack, which helps reduce manual configuration and speeds up onboarding.
Another major advantage, very well spoken about on G2, is how IBM Instana provides real-time feedback. Unlike some monitoring tools that introduce delays in surfacing issues, IBM Instana delivers instant visibility into latency problems, slowdowns, and service failures. This makes troubleshooting significantly faster because teams don’t have to dig through logs manually to pinpoint the problem.
From what I found on G2, IBM Instana excels in root cause analysis by automatically correlating application issues with infrastructure performance, making it easier for teams to isolate the exact service, dependency, or component contributing to a problem.
A related advantage is its automatic dependency mapping and distributed tracing. Reviewers note that Instana can trace transactions end to end and visualize service relationships in real time, which is especially helpful in complex microservices environments where teams need to understand how systems interact before they can fix issues efficiently.
This level of automation eliminates much of the guesswork, helping DevOps teams reduce mean time to resolution (MTTR) and address issues before they escalate into full-blown outages.
IBM Instana is a strong fit for cloud-native and Kubernetes environments. According to reviewers, it works particularly well across microservices and containerized applications, giving teams clearer observability in modern distributed systems where traditional monitoring tools can struggle to provide full context.

Instana’s interface supports day-to-day monitoring well, but teams looking for a more streamlined experience when locating specific features or tailoring dashboards may need a bit more time in setup. At the same time, its usability and broad visibility across the stack still make it a practical choice for teams that prioritize fast observability over highly granular customization.
IBM Instana’s pricing can become more noticeable as environments grow across more services, hosts, and traces, particularly for larger or rapidly scaling teams. However, many also feel that its real-time visibility, automation, and strong observability depth make it a worthwhile fit for organizations managing more complex cloud environments.
Overall, I'd say IBM Instana is a great choice for real-time application performance monitoring.
"I really like the agent deployment because it discovers services instantly without requiring us to do a lot of configuration. I also appreciate the alerting system; it has been a game-changer for improving our incident response times. On top of that, the dynamic service maps help us derive actionable insights, which are essential for our application performance monitoring."
- IBM Instana Review, Sabina K.
"My biggest grievance is the pricing structure. It's based on a per host, per agent model, which becomes incredibly expensive very quickly as you scale up large Kubernetes clusters with high node counts. For a company running a lot of smaller, ephemeral instances, the costs can start to feel prohibitive compared to the value of the tool. Additionally, I find the initial UI layout to be a bit overwhelming for new users. There is a lot of data being thrown at you at once, and it takes a significant amount of click around time to figure out how to filter out the noise and get to the specific metrics that matter for a quick health check."
- IBM Instana Review, Cecil M.
Related: Explore cloud security monitoring tools that improve visibility and security monitoring across networks and cloud-based applications.
Datadog is one of those tools that you can’t ignore when looking for cloud monitoring solutions. It’s everywhere, and for good reason. It offers real-time dashboards, deep observability, and solid integrations, making it a strong choice for cloud infrastructure monitoring.
According to G2 data, user satisfaction is high across key monitoring capabilities: 91% for usage monitoring, 88% for database monitoring, and 89% for both API monitoring and real-time cloud infrastructure monitoring.
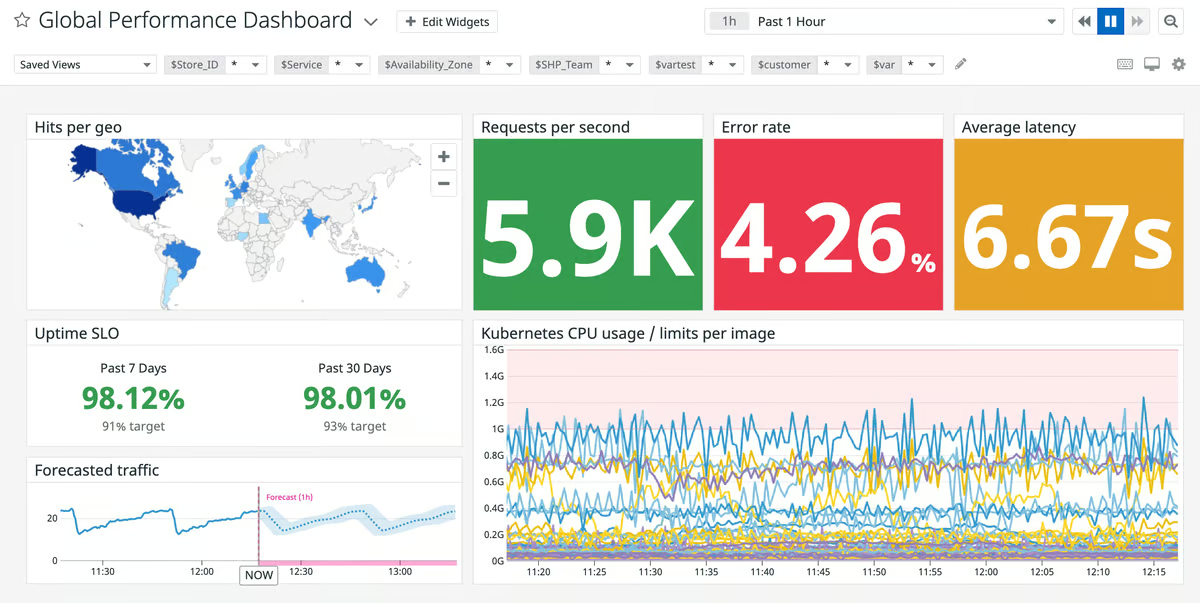
One of the biggest benefits frequently cited by G2 users is how much visibility it gives in cloud environments. The ability to deploy Datadog across multi-cloud and on-premise environments and get detailed insights into infrastructure, network traffic, and application performance is a huge plus.
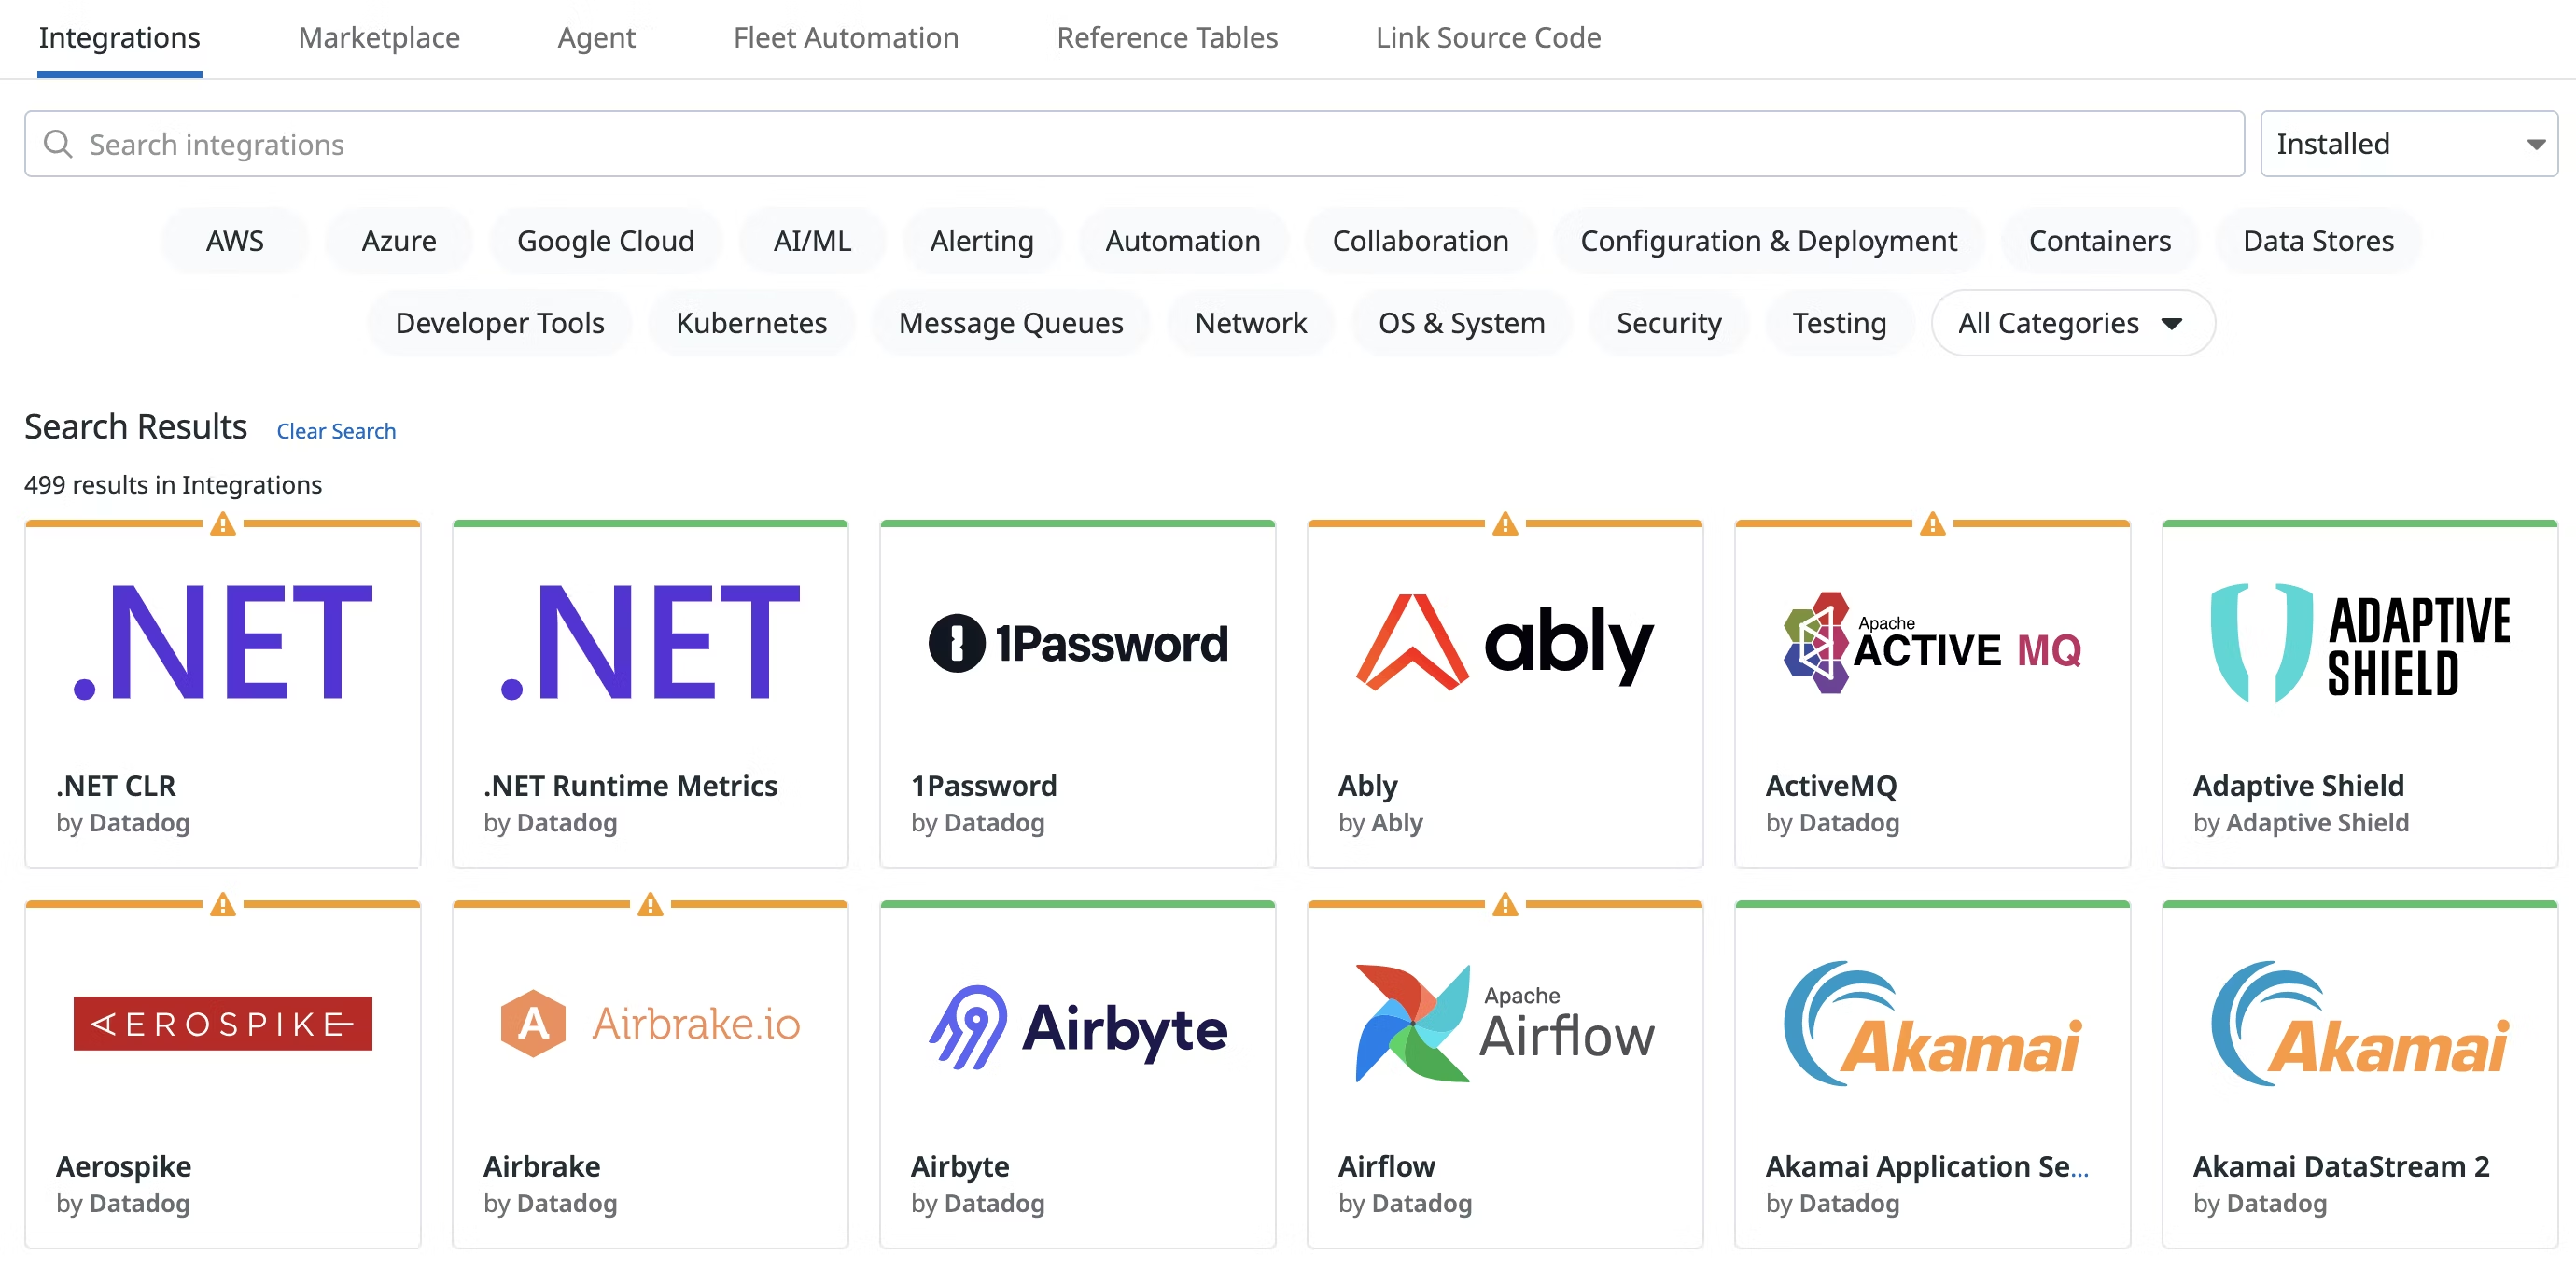
Based on my research and real user feedback on G2, deploying Datadog is easy, thanks to its straightforward agent installation and extensive pre-built integrations.
I also discovered that it has a wide range of integrations and connects seamlessly with NGINX, Kubernetes, Docker, AWS, Azure, Google Cloud, and CI/CD pipelines. For incident management and alerting, it syncs with ServiceNow, Slack, Microsoft Teams, Jira, and other tools, so alerts and issues are directed to the right people in real time.
I read quite a few reviews where the users pointed out how its features work together. The tight integration between logs, metrics, application performance monitoring (APM), database monitoring (DBM), profiling, real-time user monitoring (RUM), and Synthetics means one can easily jump between different data points without switching tools or piecing insights together manually.
Whether you are troubleshooting an application slowdown or investigating an infrastructure issue, everything flows seamlessly, making the whole experience far more efficient.
Datadog's alerting system also receives praise for its flexibility. It allows users to set alerts based on custom conditions, and tuning it right can significantly reduce alert fatigue.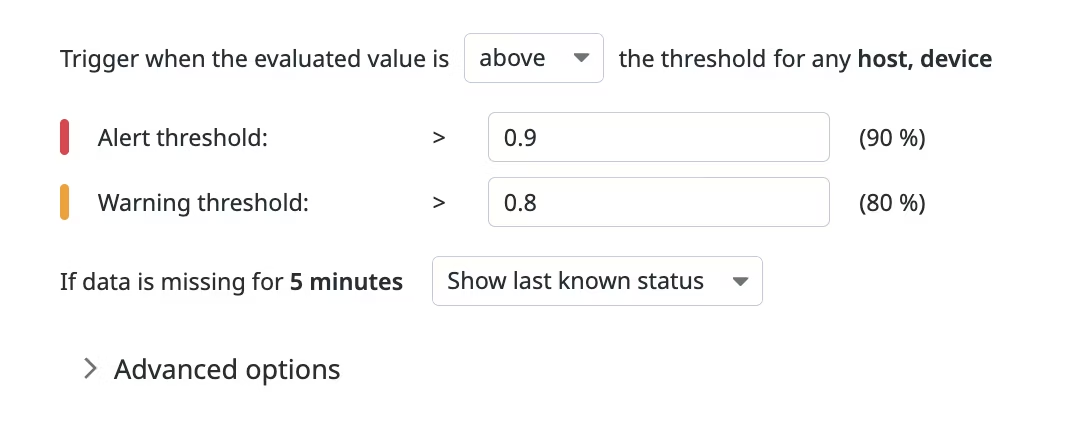
According to G2 reviews, Datadog’s usage-based pricing can scale up quickly, especially for growing teams or larger deployments with broad cloud monitoring needs. That said, many users also note that the platform’s depth, flexibility, and wide observability coverage make it a worthwhile investment for organizations that want a unified monitoring experience.
Datadog’s interface offers a high level of detail and customization, which can take some time to get used to, particularly for teams newer to cloud infrastructure monitoring. However, once users get familiar with the layout and dashboard setup process, many find that the platform gives them strong visibility and control across complex environments.
If you’re a large enterprise or a DevOps team managing a complex cloud environment, Datadog’s visibility and automation can save you time and prevent costly outages. Smaller teams, however, may need to weigh the visibility benefits against budget realities.
"I like the concept of Datadog overall. The system tracks every data point your applications provide, and you can collect and analyse it in a single space. It basically allows you to find the root cause of issues much faster, as you are able to correlate data from different sources (server load, logs, network performance, etc.) And because of all that data aggregated in one place, you can set up notifications based on multiple metrics together, not just one. Or even do something with a webhook."
- Datadog Review, Emilio G.
"Sometimes, once you have searched for something and it has filtered down to a specific context, it can be difficult to know how to expand the context to include other sources."
- Datadog Review, Jesse S.
On a budget? Explore the top free network monitoring tools.
Dynatrace stood out to me for its depth, automation, and AI-driven insights. According to G2 Data, it is used by 29% mid-market teams and 63% enterprises.
According to G2 reviews, it's a powerhouse for full-stack observability, making it a great choice for large enterprises that need visibility across applications, infrastructure, logs, traces, and user experience in one platform, especially when monitoring modern distributed systems at scale.
From what I gathered, Dynatrace integrates well with existing infrastructure and supports a wide range of technologies, which makes it easier for teams to extend observability across cloud platforms, legacy systems, and modern services without relying on disconnected tools.
Once deployed, the platform provides real-time insights into application performance, infrastructure health, and security risks, all from a single dashboard. It also helps teams keep a pulse on system availability, reducing the likelihood of unexpected outages.
What stood out to me across reviews was how much intelligence Dynatrace brings to monitoring through its Davis AI and Grail data engine. Several users called out the Problems app in particular, which uses AI to automatically detect performance issues and pinpoint root causes. That kind of automation drastically reduces the need for manual log-sifting, helping teams troubleshoot faster and more efficiently.
Reviewers praise its debugging support during incident investigation. Dynatrace helps teams move from alert to diagnosis more quickly by bringing logs, traces, topology, and service context together in one place, so engineers can spend less time manually piecing together evidence across multiple tools.
Another major strength mentioned in user reviews is Dynatrace’s request tracing capabilities, which provide deep visibility into service dependencies and transaction flows across cloud environments. This allows teams to find bottlenecks, optimize performance, and prevent issues from cascading into larger failures.

Dynatrace’s dashboard experience is structured and effective for monitoring at scale, though some teams would welcome more design flexibility and a smoother experience when customizing layouts or carrying over certain classic dashboard settings into the newer interface. That said, many users still value how much visibility the platform brings together in one place, especially for teams that prioritize depth and standardization over highly free-form dashboard design.
Pricing is another area where users expressed concerns. I saw multiple G2 reviews noting that while Dynatrace’s per-hour pricing is flexible, it can be tough to estimate overall costs without a clear understanding of your usage. Teams with large-scale monitoring needs may see costs climb quickly.
Overall, Dynatrace is well-suited for enterprises that need deep observability, AI-driven automation, and full-stack monitoring. It shines as the best cloud infrastructure management software for large-scale apps, giving DevOps teams deep visibility across containers, microservices, and hybrid cloud environments.
"Dynatrace is one of the powerful observability and infrastructure monitoring tools. It expands its capabilities with APM, DEM, and infra monitoring, along with support for databases and multiple cloud platforms. I use it daily to monitor applications and our cloud stack. It has wide integration support with third-party tools, so we can integrate and monitor almost everything in Dynatrace. They also provide active customer support, helping us when we get stuck and resolving our problems and issues. We can monitor our application’s golden metrics, such as logs, metrics, traces, and events, along with CPU, memory, disk, and other infrastructure metrics. Overall, it’s one of the best and most user-friendly tools to monitor and secure our applications."
- Dynatrace Review, Pankaj B.
"I would say the dashboarding is very block-like in its layout. While this is great for simplification, there are times when it would be good to have the ability to fully customize them with potentially overlapping dashboard widgets, backgrounds, logos, etc."
- Dynatrace Review, Keith S.
Want only APM tools? Explore the best application performance monitoring tools in the market.
New Relic acts as a source of truth for all engineers to make decisions with data across their entire software stack and the software life cycle. According to G2 Data, it is used by 21% small businesses, 49% mid-market teams, and 30% of enterprises.
I noted that New Relic stands out for how quickly it helps engineering teams move from detection to diagnosis. According to G2 reviews, users consistently value being able to connect metrics, logs, traces, and performance signals in one workflow, which makes day-to-day troubleshooting faster and more actionable without forcing teams to jump between multiple monitoring tools.
Another key strength is its real-time performance visibility. Reviewers frequently highlight how quickly New Relic surfaces response times, error spikes, slow transactions, and overall system health, helping teams catch issues earlier and stay ahead of production problems before they affect users more broadly.
New Relic has a query-driven approach to observability. Users regularly call out NRQL as one of the platform’s most valuable features because it gives teams the flexibility to ask detailed questions across their telemetry data, investigate edge cases, and build more tailored views beyond standard dashboards alone.
The cloud infrastructure monitoring software performs well for debugging across complex application flows. Based on user feedback, distributed tracing helps teams follow requests across services, connect frontend and backend behavior more clearly, and pinpoint bottlenecks with less manual investigation, which is especially useful in distributed and cloud-native environments.
Another advantage i observed is its strong support for proactive monitoring and alerting. Reviewers mention that New Relic helps teams stay on top of system behavior with alerts and live monitoring that surface issues early, making it easier to reduce mean time to detect and resolve incidents before they escalate.
New Relic also earns praise for its broad observability coverage with practical usability for engineers. G2 reviews describe it as a platform that supports application performance monitoring, infrastructure visibility, dashboards, and deeper analysis in a way that feels useful during active engineering work, not just for high-level reporting.

New Relic’s costs can become more noticeable as monitoring data increases across services, especially for teams monitoring more services or retaining more data over time. At the same time, many users still see the pricing as a trade-off for the platform’s broad observability coverage, flexible analysis, and troubleshooting depth.
New Relic’s setup can take a bit more upfront configuration for teams that want to fine-tune advanced features and get the most accurate signals from the platform. However, that added setup effort also reflects the level of depth available, and many users find it worthwhile once the system is tailored to their environment and workflows.
Overall, New Relic is a strong fit for engineering, DevOps, and IT teams that want flexible observability, faster troubleshooting, and deeper analysis across cloud applications and infrastructure without relying on a patchwork of separate tools.
"What I like most about New Relic is how quickly it gives clear visibility into application performance. I’ve used it to monitor Node.js and Python services, and integrating the APM agent was pretty straightforward both in regular deployments and containerized environments. The transaction traces and error insights make it easy to spot slow endpoints or bottlenecks. I also like the dashboards and alerts, which help keep track of application health without much effort. Overall, it makes debugging and performance monitoring much easier for engineering teams."
- New Relic Review, Amit Y.
"New Relic can feel complex for newcomers. The platform is powerful, but understanding all its dashboards, APM details, and configuration options takes significant time. Onboarding requires a noticeable investment, especially for teams new to observability tools."
- New Relic Review, Raghavareddy K.
Cloud monitoring gives you visibility, but AIOps brings clarity. Check out the top AIOps tools to turn complex cloud data into actionable insights and faster resolutions.
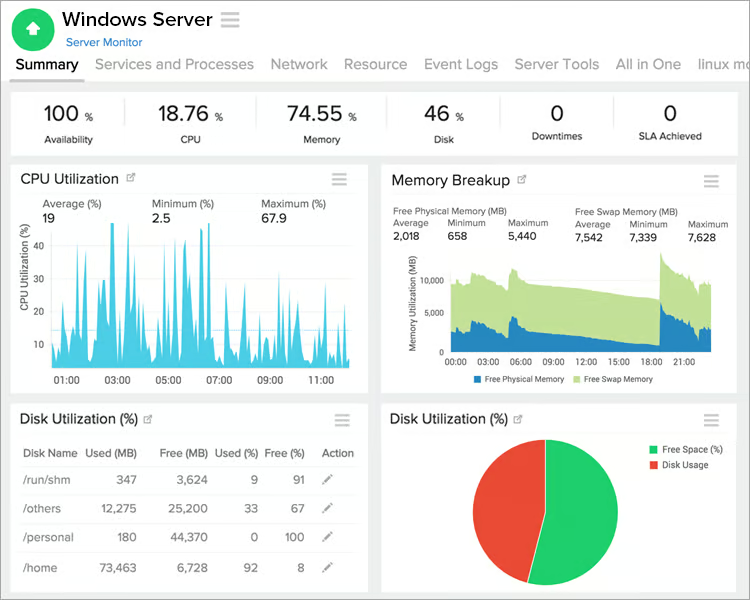
Site24x7 by Zoho provides a unified cloud monitoring for DevOps and IT operations within small to large organizations. This is supported by the G2 Data that 43% of small businesses and 43% of mid-market teams use the cloud infrastructure monitoring tool.
Site24x7 stands out for its all-in-one monitoring coverage. Reviewers consistently highlight its ability to monitor websites, servers, applications, cloud infrastructure, and network resources from a single platform, which helps teams reduce tool sprawl and manage observability from one centralized view.
Users on G2 appreciated its ability to keep an eye on multiple resources simultaneously. Users describe the platform as especially helpful for teams that need to move from high-level uptime checks to deeper infrastructure and application metrics without jumping between tools, making day-to-day monitoring more efficient.
Another strength I observed in the feedback was that reviewers frequently mentioned the ease of setup and integration. The onboarding process is deemed quick. It supports agent-based and agentless monitoring, and once deployed, it automatically discovers new resources and starts collecting data.
Site24x7’s cost-effectiveness also stands out in G2 reviews. Users frequently describe it as a more budget-friendly option that still delivers solid monitoring capabilities. It is well-suited for startups, SMBs, and IT teams looking for reliable observability without the price tag of enterprise-level platforms.
Reviews highlight its real-time alerting and proactive issue detection. Users mention that once alerts are configured, Site24x7 helps teams spot downtime, performance drops, and infrastructure issues quickly, allowing them to respond faster before those problems have a wider user impact.
Another distinct strength is its reporting and performance visibility for operational follow-through. Reviewers call out the platform’s automated reports, SLA tracking, and performance analytics as useful for troubleshooting, capacity planning, and sharing clear uptime or performance evidence with internal stakeholders.
Site24x7’s interface is functional for day-to-day monitoring, though some teams may find the navigation and configuration experience a bit more traditional than expected when setting up dashboards or refining alerts. However, once teams get familiar with the layout, the platform still offers broad monitoring coverage in one place, which can be especially useful for organizations prioritizing value and all-in-one visibility.
According to G2 reviews, Site24x7 is relatively quick to onboard, but getting the most from its more advanced monitoring settings can take some additional exploration during setup. However, once those configurations are in place, many users find that the platform runs reliably and gives them solid visibility across their environment without requiring multiple separate tools.
Based on my evaluation, Site 24x7 is a solid choice for IT teams and businesses looking for a versatile, multi-cloud monitoring solution, especially for those on a budget.
"We’ve been using Site24x7 mainly for uptime and basic infrastructure monitoring. What I like most is that it didn’t take long to get running, and once the alerts were configured, it’s been pretty reliable. When something goes down or performance drops, we usually know right away."
- Site24x7 Review, Bruno O.
"The user interface feels a bit stuck in the past. It’s functional, but it’s definitely cluttered, and finding specific advanced settings can feel like a scavenger hunt. Also, the alerting can be a double-edged sword; if you don't spend significant time fine-tuning your thresholds early on, you’ll get hit with a "storm" of individual notifications for a single incident instead of one consolidated report. The pricing model can also be a bit of a headache to navigate once you start adding various monitors and add-ons."
- Site24x7 Review, Muhammad Usama Y.
If you are a small or medium-sized business with a reasonably manageable cloud infrastructure, I'd suggest going with open-source options like Prometheus, Grafana Labs, Zabbix, or Nagios or with affordable options mentioned above like Site 24x7. These tools may require more manual setup and maintenance, but they offer relatively good monitoring capabilities.
Got more questions? G2 has the answers.
The tools highlighted here with strong G2 feedback are IBM Instana, Datadog, Dynatrace, New Relic, and Site24x7. Review quality varies by use case, team size, and infrastructure complexity.
IBM Instana, Datadog, and New Relic are all strong choices for real-time cloud monitoring. Each offers real-time visibility, but they differ in setup, pricing, and depth of analysis.
According to G2 reviews and the evaluation in this article, IBM Instana, Datadog, Dynatrace, New Relic, and Site24x7 stand out as top options, each with different strengths for different environments.
Dynatrace, Datadog, and IBM Instana are all well-suited for large-scale applications. The right fit depends on whether your team values AI-driven automation, broad observability, or real-time application performance monitoring most.
For tech startups, Site24x7 and New Relic can be practical choices depending on priorities. Site24x7 works well for affordability and broad coverage, while New Relic suits teams that want flexible observability and faster troubleshooting.
Some of the best open-source cloud monitoring tools include Prometheus, Zabbix, Nagios, and Grafana.
Prometheus is widely used for metrics-based monitoring in cloud-native environments, while Zabbix and Nagios offer full-stack infrastructure monitoring. Grafana is a powerful visualization tool that integrates with various data sources.
While these tools eliminate licensing costs, they require manual setup, maintenance, and configuration, making them ideal for teams with the resources to manage an open-source solution.
If you’re running a customer-facing app, reliability is everything. The most reliable cloud monitoring tools combine real-time observability, fast alerting, and integrations with your incident response workflows. Datadog, Dynatrace, and New Relic are frequently praised for reliability, while startups often lean on Site24x7 or open-source options like Prometheus for dependable coverage without heavy costs.
Small businesses often prioritize ease of use and affordability. Tools like Site24x7 rank highly with SMB users because they deliver full-stack visibility at a lower cost than enterprise platforms. According to G2 reviews, it strikes a balance between functionality and price, making it ideal for teams that don’t have large DevOps resources.
User-friendliness matters if you don’t have time for steep learning curves. Based on user reviews, Datadog is popular for its plug-and-play integrations, while Site24x7 earns points for simplicity and quick onboarding. If you’re looking for intuitive dashboards and minimal setup, these are often cited as the most user-friendly options.
When it comes to the cloud, I agree that the more complex the environment, the easier it is to lose track of costs, performance bottlenecks, and security risks. But I strongly insist that affordability and necessity should guide your choice of a cloud monitoring tool.
Ask yourself: Why do you need monitoring? What are you tracking? And what value do you expect from it? These non-functional aspects are hard to price but critical for budgeting.
If you're monitoring a single app generating $10K/month, a $2K/month monitoring tool might not be justified. But if you're managing a dozen apps driving $500K/month, that investment could pay off by improving uptime, reducing maintenance costs, and scaling efficiently.
For large-scale enterprises, premium solutions like Dynatrace or Datadog automate workflows and improve response times. But if you want the best affordable cloud infrastructure monitoring service, tools like Site24x7 or even open-source platforms like Prometheus or Grafana can step in.
At the end of the day, choosing a cloud monitoring tool isn’t just about features. It’s about aligning with your operational needs, budget, and long-term strategy. The right tool should give you confidence in your infrastructure, not just another dashboard to stare at.
Still on the hunt? Explore our categories of monitoring software, from application performance to network, to find the right match for your needs.


Picking the right one from the best AIOps tools in the market directly affects how quickly...
 by Disha G

Application Performance Management (APM)
I’m no stranger to applications crashing, freezing, or throwing errors at the worst possible...
 by Harshita Tewari

G2 Grid® Report · Summer 2026 Best Log Monitoring Software Updated May 26, 2026 View...
by Soundarya Jayaraman