
Marketers love data.
There’s no question about it – those numbers are capable of proving their performance is worthwhile. Determining the effect of marketing efforts can be part of what influences the upcoming budget and reassures executives that you know what you’re doing.
But that data comes from everywhere, making it difficult when you’re trying to tell one cohesive story about your accomplishments. That story is in there, somewhere among all of those platforms and tools.
It would be much easier to see all of that important information in one place.
A marketing dashboard is a platform that summarizes marketing KPIs and metrics. It works to simplify sometimes complex analytics and make data easier for anyone to consume. These dashboards are highly customizable and often need to updated frequently so that they can be used to report progress to stakeholders and additional team members.
While the idea of putting all of your data together is simple, the thought put into it is not.
Before digital marketing dashboards, we could only hope that the time, money, and resources that marketing activities take up are worthwhile.
Marketing dashboards are more than a beautiful, comprehensive display of all of the data that’s most important to you. These dashboards should be designed to prove – to your colleagues, boss, or client – that the steps you’re taking are ones that are moving you in the right direction.
The amount of marketing metrics we have available to us are unfathomable, which is part of the reason why a digital marketing dashboard is so helpful.
By providing teams with easily readable displays of the performance of all of their marketing campaigns and channels, digital marketing dashboards provide a visual overview of key metrics.
“A well-designed marketing dashboard you can live, eat, and breathe makes all the difference. When strategically focused, it will enable you to face every ball aimed at you and catch it with confidence.”
Georges Benoliel
Founder of NestApple
Marketing associates and marketing managers should absolutely be on the same page, but it’s important to realize that your department is a little fish in a much bigger pond.
Nobody likes a knowledge hoarder; sharing that information with executives and clients is crucial to giving everyone a better understanding of where their resources are going and their ROI.
Those numbers aren’t just there to inform you of the past, they’re also there to inform you and others about the decisions you make for your future.
Collecting data once a month can be enough for some companies to make broader decisions. But if teams want to get into the nitty-gritty of the situation, having access to a real-time dashboard can provide unparalleled benefits.
For example, testing the effectiveness of new landing page copy by watching conversion rates rise or fall can inform your copy editor whether they need to make a fast change.
Sometimes we dive so deeply into our analytics that we forget the importance of taking a step back to see the bigger picture.
With a marketing dashboard, you can clearly see the high level picture regarding how your team is performing, as well as get the insight regarding why your team is performing the way it is. When you uncover the answer to the why, you can begin to take the steps to improve even further.
As stated above, there are a multitude of metrics that you can choose to display on your dashboard. While this may seem liberating, it can also turn into a confusing venture for a digital marketer to make decisions about one, almighty dashboard.
That’s why you should have several dashboards operating simultaneously for different marketing roles.
The reason for this is that the metrics that indicate the success of one role are not the same as the metrics that will indicate the success of others. Instead, having dashboards organized with KPIs specific to the varying roles in your department is key.
Below are some marketing dashboard examples that you and your team can set up for those positions.
Your CMO (Chief Marketing Officer) usually has more important things to do than check everyone else’s dashboard under a microscope. Because of this, it’s important to provide your CMO with a dashboard designed especially for them.
"Here at G2, there are quite a few things I’m looking for on my dashboard. One of the most important metrics that I like front and center is ROI: how much net new business did marketing source in comparison to the money we’ve spent over the year? By working out the marketing costs when taking a look at things like headcount and program spend, seeing that number in comparison to how much we’re making is a crucial indicator of our team’s success,” says Ryan Bonnici, CMO of G2.
One of the smartest ways to go about building this particular dashboard is by identifying the long-term KPIs of your department. Those KPIs should be framed at the top of this dashboard to provide an overview so your CMO can get an idea of how your team is performing at a glance.
Overall, your CMO’s dashboard should be designed to present the data that will help them improve their performance, as well as the performance of the team.
“...By working out the marketing costs when taking a look at things like headcount and program spend, seeing that number in comparison to how much we’re making is a crucial indicator of our team’s success.”
Ryan Bonnici
CMO at G2
Building a Google Ads dashboard can help you track the success of your advertising campaigns.
Capable of monitoring metrics from a Google Ads account in real time, a Google Ads dashboard can be customized to show the metrics you need to determine your success without wasting any time digging through each and every one.
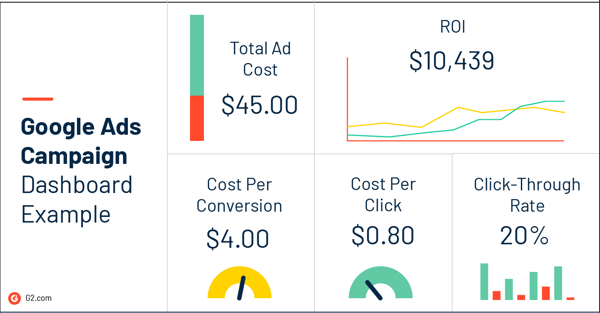
Marketing analytics software is capable of integrating with other platforms like Google Ads so that metrics from any software can all be collected and displayed in one place.
To get you started, know that a Google Ads dashboard can include key metrics like:
Email marketing is a great way to stay in touch with your customers and beyond. Instead of focusing on email blasts, today’s email marketers are keeping a closer eye on trends in their metrics to determine new, engaging ways to reach to different segments of their audience.
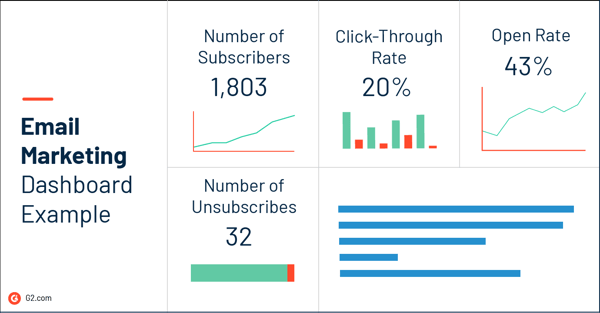
Your email marketing dashboard should display key metrics that demonstrate your performance and ROI of your email campaigns. By having a place where key metrics are displayed and updated in real time, email marketers have constant opportunities to improve.
To get you started, know that an email marketing dashboard can include key metrics like:
With content marketing, there are so many different metrics to track that it’s hard to know what to put on your dashboard. Content marketing is an activity that involves numerous efforts, often from more than one person.
In order to determine what to include on your content marketing performance dashboard, it’s important to choose the KPIs that demonstrate how content marketing adds value to your business.
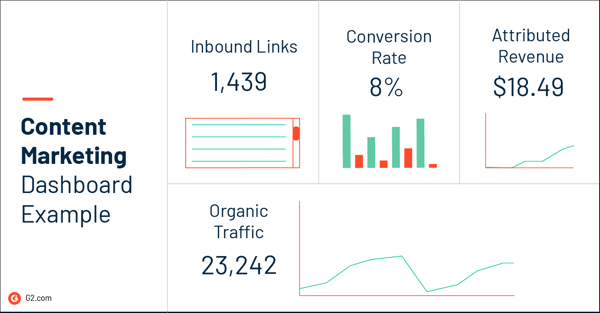
Content marketing works as a way to bring more recognition to your business, sometimes from audiences that other, more traditional marketers, wouldn’t normally be able to reach.
To get you started, know that a content marketing performance dashboard should include metrics like:
More than one metric is needed to determine the success of your SEO efforts. When creating your SEO analytics dashboard, it’s important to add the information that is most likely to indicate a need for change.
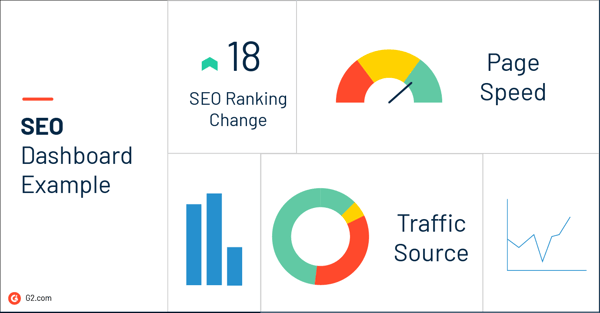
Dashboards aren’t just for marketing teams; from terminology to the abstract strategies, SEO is one of the least black-and-white subjects within marketing. Your SEO dashboard can help you better explain your strategy to any clients you may be working with who aren’t familiar with the concept.
To get you started, know that an SEO analytics dashboard may include metrics like:
Social media marketing involves tracking engagement metrics from multiple social media platforms like Twitter, LinkedIn, Facebook, LinkedIn, and Instagram. While each of these platforms has their own analytics tool, it’s important for social media managers to have a third-party dashboard that brings all of those metrics together.
A social media marketing dashboard should be set up so that you can analyze demographic data across platforms, compare and contrast your engagement across all platforms, and get a clear vision of your social media ROI.
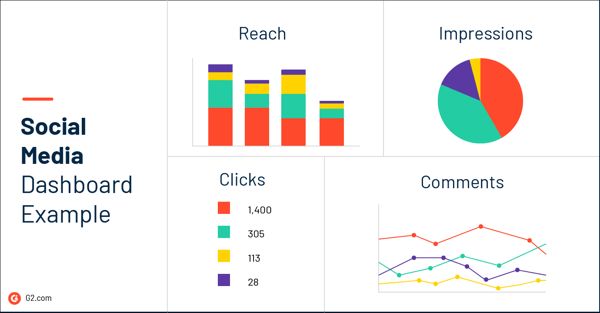
Those who work in social media often fall prey to vanity metrics such as the amount of followers they have. Numbers like these are pretty to look at, but don’t give genuine insight into how social media marketing efforts are impacting other marketing efforts.
While it’s okay to include these metrics on your dashboard, it’s important to make room for metrics like:
When your business is almost, if not 100% online, you should absolutely be putting all of the data you’re collecting in one spot.
Because of how much data e-commerce sites collect, the way you set up your dashboard will ultimately be determined by what you’re looking to achieve and improve upon in the future, just like any other dashboard.
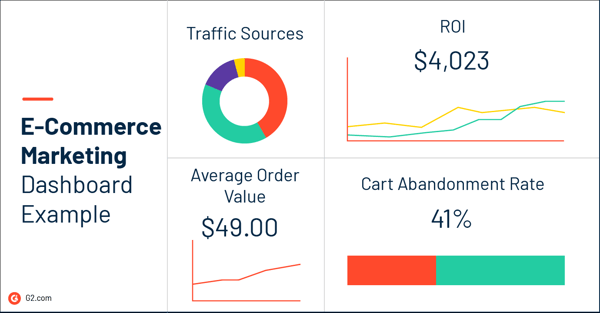
If you’re looking to track something particular, it may be best to set up more than one dashboard: one for specific use cases, such as tracking a certain campaign, and one for a general overview of your performance.
In the dashboard displaying your overview, consider adding KPIs like:
There are hundreds of different software products that make marketing dashboards a possibility. Like marketing analytics software, both business intelligence software and marketing automation software are also capable of displaying dashboards.
Business intelligence software provides a standalone dashboard with an overall view of activities, while marketing automation software has the capability to provide a more in-depth view.
Marketing automation software may also require a little more time and intellectual effort to draw larger conclusions. Working with a standalone extension of business analytics software often means paying an additional price beyond the software itself, while marketing automation provides these services as part of their initial software offering.
If you’re struggling to decide which software will work best for you and your team, know that the following characteristics are often present in some of the tools:
While the above examples are a push in the right direction, marketing dashboards aren’t so clear cut. Know that mistakes can be made as marketers learn how to improve and grow their marketing dashboards to their business goals.
Below are some of the most common mistakes that are made with these dashboards so that you and your team can be aware of and avoid them.
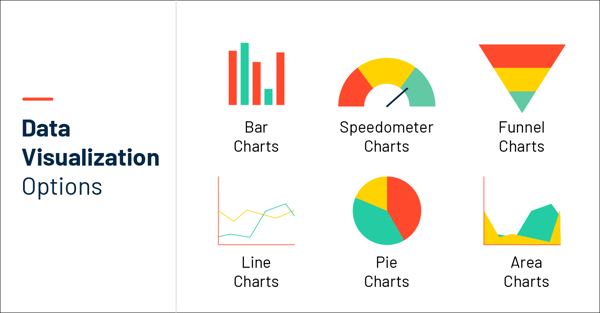
One of the most useful characteristics of marketing dashboards is that they have the ability to make complicated data easier to understand with the use of data visualization. All of those pretty options mean a harder decision for marketers to make: which one should you be using?
Knowing the use cases for each of your options is crucial to ensure that your marketing dashboard is communicating the story that you want it to.
Marketing dashboards are highly customizable, and that opportunity shouldn’t be taken for granted. Just because you can use an abundance of colors doesn’t mean that you should.
Generally, using two or three colors consistently (ideally from your brand) throughout your dashboards is enough. These colors should not only represent your brand, but should also be used with communication in mind. If you’re trying to make a certain section of a graph or chart stand out, do it with the brightest color from your scheme.
Butts = X ÷ Y
Just like there is such a thing as using too many colors, there is also such a thing as using too many charts.
The entire purpose of a dashboard is to have everything in one place and communicate results as simply as possible. There will be times when a chart is not needed because the number is communicating enough.
Do not overcomplicate your dashboard with charts when a number could do the trick.
Above, we've gone over the importance of differentiating between dashboards for the sake of your audience. Each marketing dashboard should be read like a story and relate to the reader in order to be effective.
Failing to realize that every type of marketer is going to be looking at different KPIs can result in poor productivity, inaccurate data, and, most importantly, will not lead to positive change in an efficient manner.
Dashboards are there to display the most valuable information to the viewer. But just like Syndrome from The Incredibles once said, “When everyone is super, no one will be”.
If you throw a ton of KPIs on your dashboard, it’ll be difficult for the viewer to be able to determine which ones are the most important, ultimately making them all lower in value.
Make sure that the KPIs you’re choosing to display are ones that support the overarching goal. If they don’t, you know what to do.
The discussion of vanity metrics has been weaved throughout this article, but avoiding their use in marketing dashboards is so important that we’re bringing it up again.
There are a wealth of factors that have the ability to impact the quality of the data you use on your dashboard. Working with someone who is accounting for the accuracy and feasibility of the data or using a data cleaning tool can help with the avoidance of this issue.
Proving the value of what you and your team are doing on a day-to-day basis isn’t easy, but marketing dashboards certainly make it a little less painful.
With the right team and the right tools, having a digital marketing dashboard can help further clarify where you’re finding success and what work needs improvement.
Learn more about the marketing metrics to include on your dashboard.


Most managers are on a constant lookout for tools and tweaks that make their team’s work...
 by Laura Nunneley

There’s no escaping it; it’s all around us.
 by George Rowlands

There are plenty of customer feedback management solutions out there, but most of them are...
 by Alyona Medelyan