January 9, 2019
 by Devin Pickell / January 9, 2019

Your fiscal year has ended, and now its time to figure revenue, expenses, gains, and losses to measure overall financial performance.
This financial performance will be reflected in one of the most important documents a company will compose – an income statement.
An income statement is a financial document breaking down all revenues, expenses, gains, and losses for a company during an accounting period. Near the bottom of this document is a company's net income.
There are many components of an income statement that should be documented. Everything from rent, transportation, interest payments, depreciation, amortization, and much more must be factored.
To clear things up, we’re going to break down the structure of an income statement using a real-world example and provide a free downloadable template so you can input your own figures. Let’s get started.
Perhaps the clearest way to explain the structure of an income statement is by dissecting it into smaller pieces and explaining the significance of each entry from the top-down.
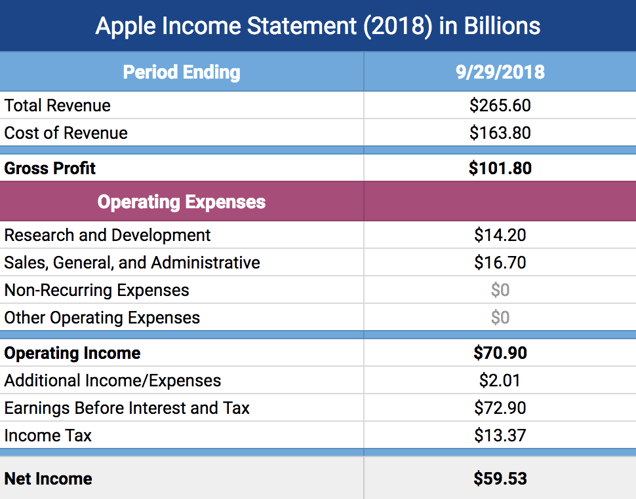
For the example used in this article, we’re breaking down the 2018 income statement for Apple, Inc.

Starting at the very top of the income statement, we see Apple’s total sales conducted throughout an accounting period. This can also be reflected as “total revenue” or “gross sales.” This figure for Apple totaled $265.6 billion.
Total sales are quite straightforward. Every Apple product sold in the 2018 fiscal year is reflected in this number.
Did you purchase a new iPhone, iPad, Macbook, or other Apple product? If so, you contributed to Apple’s total revenue.
Next comes Cost of Goods Sold, or COGS. In the income statement provided by Apple, this is listed as the “cost of revenue,” but may also be referred to as “cost of sales” – the terms are interchangeable. This figure for Apple totaled $163.8 billion.
COGS accounts for beginning inventory costs and additional inventory costs, minus a company’s ending inventory costs.
For Apple, these costs were the raw materials purchased to develop their latest products. COGS is also the direct labor associated with the development of Apple products, and the costs to keep factories up-and-running.
In simple terms, COGS is the cost of doing business.
Gross profit can only be determined after total sales and COGS have been calculated.
To find gross profit, a company subtracts COGS from its total sales. In the case of Apple, this is $265.6 billion - $163.8 billion = $101.8 billion gross profit. Not a bad year.
Gross profit is a metric used to ensure a company is making more money than its spending on developing its goods or services. A negative gross profit signals to investors and creditors that a company may not be sustainable.
Congrats, the first major line in the income statement is now calculated. Time to move onto operating expenses.
While the top line of an income statement is pretty uniform across all companies, operating expenses could look totally different depending on company size and industry.

For tech corporations like Apple, one of the largest operating expenses is research and development. This expense typically appears on income statements for companies engaged in scientific undertakings. In Apple’s case, they spent a whopping $14.2 billion on R&D.
All companies will have SG&A operating expenses. In layman’s terms, SG&A stands for Selling, General, and Administrative expenses.
SG&A are all major expenses outside the direct development of a product or service. These are your marketers, your advertisers, salespeople, financers, office admins, IT staff – essentially your day-to-day employees keeping the business side of things up-and-running.
But SG&A goes beyond physical employees. It can also account for office supplies, computers, rent, utilities, and even company-wide software.
Unsurprising, SG&A is typically the largest operating expense on an income statement. For Apple, this figure totaled $16.7 billion.
Non-recurring expenses may differ greatly depending on company income statements, simply because they are one-time occurrences.
For example, if a company moved offices throughout the accounting period, this would show up as a non-recurring expense.
Other non-recurring expenses include losses due to property damage like fire or flooding, lawsuit payments, losses on equipment due to theft, and more.
For Apple, there were no non-recurring expenses this past fiscal year.
The final line under operating expenses consists of other unlisted expenses. The two most common of these expenses include depreciation and amortization.
Apple noted no other operating expenses in its latest income statement.
Near the top of the final line, we have operating income, which measures how efficient a company is at managing its profit against its expenses.

To find operating income, a company subtracts all operating expenses from its gross profit. In the case of Apple, this is $101.8 billion - $14.2 billion - $16.7 billion = $70.9 billion operating income. That’s a very good operating margin.
High-level executives may break down operating income to see how well its managers are at handling day-to-day decision making.
Operating income can also act as a safety net for companies during difficult financial or economic times.
This line is commonly referred to as “non-operating expenses,” which basically includes the accrued interest on any payable loans, bonds, debt, lines of credit, and any other borrowings.
While we don’t know the exact sources of non-operating expenses for Apple, its total for this past fiscal year was $2.01 billion.
Below non-operating expenses are Earnings Before Interest and Tax, also known as EBIT.
This line is pretty straightforward and is calculated by adding non-operating expenses to operating income. For Apple, this figure totaled $72.9 billion.
In accounting, operating income and EBIT are generally the same thing even though they appear on different lines in an income statement.
The final line before calculating net income is the total amount of income tax a company is expected to pay at the end of an accounting period. We can see from this income statement that Apple will pay out $13.37 billion.
Currently, Apple is the world’s largest taxpayer, with an effective tax rate of 24.6 percent. This is much higher than average U.S. multinational corporations, however, not all companies pay the same rate.
We’ve now arrived at the net income, also referred to as “bottom line.”
Net income is one of the most important financial metrics a company, its shareholders, and investors will monitor simply because it’s an indicator of both short and long-term health of a company.
A positive net income ensures sustainability, keeps shareholders happy with higher stock prices, attracts new investors, and shows creditors a company’s ability to pay back business loans.
To calculate net income for Apple, we’ll subtract income tax from EBIT. Thus, $72.9 billion - $13.37 billion = $59.53 billion net income.
Now that you know every component of the income statement, you’re ready to compile your own using Microsoft Excel.
Download this free Excel income statement template, input your company’s latest figures, and the template will do all the calculations automatically. Simple enough!
Also, feel free to check out the top accounting software on G2 Crowd right now. This software assists with a myriad of accounting-focused tasks, such as maintaining general ledgers, charts of accounts, accounts payable workflows, and much more!
Devin is a former senior content specialist at G2. Prior to G2, he helped scale early-stage startups out of Chicago's booming tech scene. Outside of work, he enjoys watching his beloved Cubs, playing baseball, and gaming. (he/him/his)
Position your brand for success.
 by Hannah Tow
I often ideate and mentally prototype a bootstrapped brand. One of the initial thoughts that...
.png) by Shreya Mattoo
by Shreya Mattoo
Position your brand for success.
 by Hannah Tow


