

Signing on the dotted line screams big commitment for a buyer and good news for a seller.
But not all deals are created equal. Beyond the number of contracts closed, what really matters is how much each deal contributes to your business annually. That’s where annual contract value (ACV) comes in, a metric that reveals the financial impact of every signed agreement.
Annual contract value (ACV) is the average revenue a business receives from a customer in a one-year contract. ACV simplifies revenue tracking by normalizing multi-year contracts into yearly values. For example, a $60,000 three-year deal equals a $20,000 ACV.
ACV is a key metric for sales performance management, helping teams connect deal size with broader revenue goals. By tracking it over time, businesses can monitor sales efficiency, identify high-value customers, and make informed decisions about pricing and forecasting.
A sales analytics tool can make this process easier by consolidating ACV data, tracking progress against targets, and highlighting where to course-correct.
However, ACV alone doesn’t tell the full story. To understand profitability, it’s best compared with other sales metrics like customer acquisition cost (CAC). Evaluating ACV against CAC helps you determine how many deals your team needs to close, and at what value, to generate sustainable revenue growth.
In this article, you’ll learn how to calculate ACV, understand its role alongside key SaaS metrics like ARR and TCV, and see how businesses use it to guide pricing, forecasting, and growth strategies.
Whether you’re a SaaS founder, sales manager, or revenue ops leader, this guide will help you measure ACV in context and use it to make smarter sales decisions.
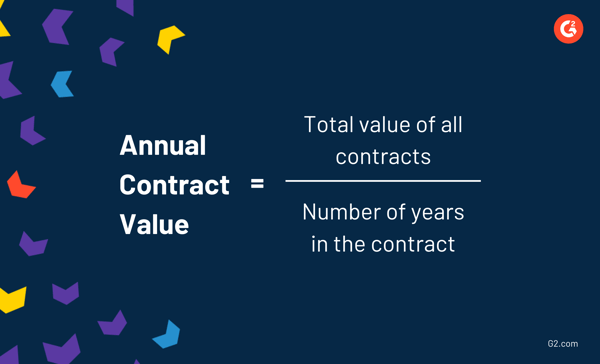
Annual contract value includes the value of all revenue from subscriptions normalized across one year. To calculate your ACV, take the total value of all of your contracts and divide that number by the total number of years in the contract. The ACV formula is as follows:
Unfortunately for those looking for perfect consistency in every sales metric, ACV doesn’t provide that. Each business might have their own individual method of calculating ACV.
Some might use the basic equation given above, but others might take the following values into account:
With that formula in mind, let’s look at an example of how to calculate ACV with both a short-term and long-term customer.
Your long-term customer, Fake Company 500, has signed a 5-year contract with your business worth $125,000. Fake Company 500 will pay an annual fee for your solution. The ACV for Fake Company 500 would be $25,000 per year.
$125,000 / 5 years = $25,000 per year
Say you have another customer, Real Company ABC, that’s more interested in a short term commitment. They signed a 6-month contract worth $4,000 and will be making payments monthly. Since ACV is averaged over the year, as opposed to the length of the contract, the ACV for Real Company ABC is $4,000 per year.
$4,000 / 6 months = $4,000 per year
The best way to find your ACV across all current customer accounts is to do so while comparing it to annual recurring revenue, which will be discussed next.
Because it’s simply an additional method for representing revenue in some way or another, average contract value isn’t that great of an insight standing alone. Businesses measure ACV to see how they’re performing in other key areas - a popular one being CAC.
CAC is the cost associated with convincing someone to purchase your solution. Comparing revenue-adjacent values against CAC is an effective way to measure the profitability of a business. For example, businesses will compare CAC to customer lifetime value (CLV) and determine if the value of a long-term relationship with a customer is enough to account for the cost of acquiring them.
The comparison of ACV and CAC asks the question: “How many deals do I need to close to cover my customer acquisition cost?”
Because ACV is averaged across all current subscriptions, it offers insight into how many deals a business needs to close to make a certain amount of money. Businesses will look at CAC and determine how many deals they need to close to cover it (based on ACV).
For the reason stated above, ACV is also used when setting revenue goals. Businesses will take annual contract value and conversion rate into account when forecasting revenue for a certain time period.
For example, if your ACV is $10,000 and your sales team hovers around 4 deals a quarter, you can project that your business will generate an estimated $40,000 in revenue that quarter.
Tip: Acquiring new customers is tough, and you don’t want to waste money trying to reel in people who aren’t even interested. G2’s Buyer Intent Data can show you the companies researching your business, so you can reach out to the right person at the right time.
In addition to ACV, there are other key subscription metrics in the SaaS space that help businesses understand their revenue streams and growth potential. Let’s dive into annual recurring revenue (ARR) and total contract value (TCV), and see how they complement ACV to give a full financial picture.
Annual contract value and annual recurring revenue are seen as cousins in the sales world. Because the definitions are so similar and the values can sometimes overlap, annual contract value and annual recurring revenue are often confused with each other. Let’s set the record straight.
ACV is the average amount of money being generated from subscription-based activities for that year. ARR is the value of recurring revenue of a business’s subscriptions for a single calendar year. Essentially, it’s the yearly income from one subscription.
When only one customer’s ARR and ACV are being measured, they’re often the same value - the amount of money that a business will make from that customer for the year. Things get a bit more confusing when looking at total ACV vs. ARR.
The best way to show an example of ACV and ARR is to work with multiple customers and measure values over multiple years.
Let’s break it down by customer and then show the combined total ACV and ARR for this business, using Fake Company 500 again.
Customer A agrees to a $2,000 contract for one year. They will pay Fake Company 500 annually. Since the value of the contract is $2,000 and the number of years in the contract is one, ACV is $2,000. Because Fake Company 500 will be receiving $2,000 in revenue for the year from that customer, ARR is $2,000.
ACV: $2,000
ARR: $2,000
Customer B agrees to a $1,600 contract for two years. They will pay Fake Company 500 annually. Since the total value of the contract is $1,600 and the total number of years in the contract is two, ACV is $800. Because Fake Company 500 will be receiving $1,600 in revenue across two years, ARR is also $800.
ACV: $800
ARR: $800
Customer C agrees to a $1,200 contract for three years. They pay Fake Company 500 annually. Since the total value of the contract is $1,200 and the total number of years in the contract is three, ACV is $400. Because Fake Company 500 will be receiving $1,200 in revenue across three years, ARR is also $400.
ACV: $400
ARR: $400
Now, that might not look like much and you might be a bit confused. Bear with me! Once we do a final calculation for the year that takes all three customers into account, the difference between ACV and ARR will make a lot more sense.
Let’s start with ARR. To calculate ARR, simply add the value from each contract that Fake Company 500 will be receiving that year.
In Year 1, Fake Company 500 will receive $2,000 from Customer A, $800 from Customer B, and $400 from Customer C, resulting in $3,200 in annual recurring revenue.
$2000 + $800 + $400 = $3,200
At the end of Year 1, Customer A’s contract has ended, so they’ll no longer be paying a subscription. In Year 2, Fake Company 500 can expect another $800 from Customer B and $400 from Customer C. Their ARR for Year 2 would be $1,200.
$800 + $400 = $1,200
In Year 3, Customer C is the only one remaining with a contract. Since they pay $400 a year, the ARR for Fake Company 500 would be $400 for Year 3.
Now let’s take a look at ACV.
In Year 1, Fake Company 500 will generate $2,000 in revenue from Customer A, $800 from Customer B, and $400 from Customer C. There are three contracts in question, so Fake Company 500’s ACV for Year 1 is $1,067.
$2,000 + $800 + $400 = $3,200 / 3 = $1,067 per year
In Year 2, just like with ARR, Fake Company 500 will only be generating revenue from Customer B, who will pay $800, and Customer C, who will pay $400. The ACV for Year 2 would be $600.
$800 + $500 = $1,200 / 2 = $600 per year
In Year 3, Fake Company 500’s only customer is Customer C. Since they pay $400 a year, the ACV for Year 3 would be $400.
$400 / 1 = $400 per year
When speaking on ACV, it’s important to touch on total contract value as well.
TCV refers to the total value of a contract, including fees and recurring revenue. ACV is a good value to measure when determining which customer is offering the most consistent income, but TCV tells you which contract is the most valuable overall.
To calculate TCV, simply add the total recurring revenues from the contract to the additional contract fees. For example, if you close a deal with a $100 onboarding fee and a $20 a month subscription for 12 months, your TCV will be $340.
$100 + ($20*12) = $340

ACV helps businesses understand the average yearly revenue generated from each customer contract. It’s especially useful for SaaS and subscription-based companies that deal with multi-year deals or tiered pricing models.
ACV gives finance and leadership teams a predictable view of annual revenue. It helps align sales targets, marketing budgets, and hiring plans with realistic revenue expectations.
By tracking ACV per customer or account, businesses can identify high-value clients and tailor their account management or upsell strategies accordingly.
Sales teams use ACV to evaluate deal quality. Instead of only celebrating big one-time wins, ACV emphasizes sustainable, recurring revenue growth.
ACV is a key metric in investor presentations, as it highlights a company’s ability to generate consistent, renewable revenue, an important indicator of long-term stability.
By analyzing ACV trends, companies can pinpoint which product lines, pricing tiers, or customer segments drive the most value and double down on those opportunities.
For SaaS companies, Annual Contract Value (ACV) is one of the most critical metrics for evaluating recurring revenue and long-term growth potential. Since most SaaS revenue comes from software licensing or subscription contracts, the average value of each deal directly impacts overall business performance.
SaaS leaders often ask, “What’s a good ACV for my business?” The truth is, it depends. Companies can thrive with both high and low ACVs, as long as they balance it with their customer acquisition cost (CAC).
A good ACV is one that supports sustainable growth relative to your CAC and retention rates. If your ACV outweighs the cost of acquiring a customer, you’re in a healthy position. Over time, tracking ACV trends helps SaaS businesses:
Don’t compare your ACV to industry giants. Instead, focus on your unique customer base, pricing model, and acquisition strategy. The goal isn’t to have the highest ACV. It’s to maintain a profitable balance between revenue and customer costs.
Now that you know how to measure your annual contract value and understand which metrics to compare it against, you might’ve realized that your ACV could use a little help.
Because ACV depends so heavily on your specific solution and business plan, it’s hard to round up a group of factors that can be changed to consistently result in a higher ACV. Something that works for one business can be completely wrong for another.
However, there are two things you can do to boost your ACV that might seem obvious, but are worth noting.
As your customers and their businesses grow, so will their software needs. Finding opportunities to up-sell, which is a sales technique where a rep attempts to convince the customer to buy a more expensive solution, is a great way to increase the value of your average contract. More money equals more value.
However, you need to be careful when up-selling to your customers. Yes, it’s your job as a sales rep to close deals for your business and generate as much revenue as possible, but you are also there to serve the customer. If they feel pressured to make a purchasing decision they aren’t ready for, you could lose their business altogether.
Gain a deep understanding of their business, watch for growth, and present the opportunity when it makes the most sense for them, not you.
Tip: The best way to up-sell is to understand your customers and anticipate their needs. CRM software can help you build that necessary relationship, so when the time comes for them to upgrade to a new solution, you’ll be ready.
This one can’t be elaborated on too much - raising your prices will increase your ACV. Again, more money equals more value.
While the idea is simple, the process of doing so isn’t. When raising prices, there are some things that will make your customers angry and stingy with their wallets. Not giving them enough notice or tricking them into signing a contract without pointing out the price change can result in those customers walking away without a second thought.
You might be able to get away with raising your prices, but never ever do so maliciously. Treat your customers the way you like to be treated as a buyer.
To make this analysis easier, many companies rely on sales analytics tools to track and visualize ACV data. These platforms consolidate information from your CRM, pipeline, and performance dashboards to reveal patterns in deal value, win rates, and customer segments. Instead of manually crunching numbers, sales teams can see in real time where average contract values are trending, and course-correct before revenue dips.
When evaluating analytics tools for ACV tracking, look for features that go beyond simple reporting. The right platform should help your team connect sales performance metrics to revenue outcomes. Here’s what to prioritize:
Beyond functionality, it’s worth understanding how sales analytics adoption looks across different types of organizations. According to G2 Data on sales analytics tools, usage is fairly balanced: 39% of users are small businesses, 42% are mid-market companies, and 19% are large enterprises.
Most teams also report that they can fully implement and go live within 2.5 to 3 months, meaning insights into ACV and other performance metrics start surfacing quickly after rollout.
Ultimately, the best sales analytics tool is one that fits your data environment, scales with your sales team, and delivers visibility into the numbers that matter most, like ACV, CAC, and conversion rates.
Top sales analytics tools, according to G2's Fall 2025 Grid Report, include:
For more insights, read this in-depth guide on sales analytics software to compare features, read verified user reviews, and find a platform that helps you turn your ACV insights into measurable growth.
Got more questions? We have the answers.
Several leading sales analytics platforms provide real-time dashboards to track key metrics, including ACV, ARR, CAC, and win rate. Tools such as Salesforce Sales Cloud, Hubspot Sales Hub, Clari, Gong, InsightSquared, and Zoho Analytics give teams instant visibility into performance data pulled from CRMs.
The best fit depends on your company’s size and data ecosystem. G2 Data shows high satisfaction ratings for Clari, Salesforce Sales Cloud, and HubSpot Sales Hub, which integrate forecasting, pipeline analytics, and KPI tracking into one workspace.
These platforms help connect pipeline health with revenue impact, showing how deal value, win rate, and CAC collectively influence ACV and overall growth.
For enterprise sales teams, Salesforce Sales Cloud, HubSpot Sales Hubs, and Clari consistently rank among the top-rated sales analytics tools on G2. Large organizations rely on these platforms for scalability, customizable dashboards, and strong data integration.
Sales analytics tools reveal which customer segments, pricing tiers, or reps drive the highest annual contract values. By analyzing patterns in deal size, renewal likelihood, and upsell success, teams can refine their targeting and increase revenue efficiency.
The key is to combine ACV insights with broader sales data, like CAC and conversion rates, to identify the right balance between closing volume and maximizing deal value.
Implementation times vary depending on your company’s size and data setup, but G2 data shows most organizations can fully implement and go live within 2.5 to 3 months. That means teams can start uncovering ACV and revenue insights soon after rollout.
You can explore top-rated platforms, read verified user reviews, and compare features directly on G2’s Sales Analytics Software page.
Each listing includes user satisfaction ratings, implementation timelines, and feature comparisons to help you choose a platform that aligns with your ACV, ARR, and CAC tracking needs.
Annual contract value is an often overlooked and underestimated sales metric. While it doesn’t mean much standing alone, comparing ACV against other values provides valuable insights when making business decisions.
Stay informed by getting a good grip on what ACV makes sense for your business and never lose sight of it - or you might suffer the consequences.
ACV can be used to inform a lot of other parts of your selling strategy, including quotas. Learn how to set sales quotas that align with your ACV, benefit the business, and motivate your reps.
This article was originally published in 2020. It has been updated with new information.


The entire contract drafting process can take quite some time.
by Mary Clare Novak

In simple terms, a contract is a promise (but one that can carry serious legal weight).
by Mary Clare Novak

In the world of sales technology, CRM, sales intelligence, proposal generation, and sales...
 by Gideon Thomas