April 30, 2019
 by Alexa Drake / April 30, 2019

Did you know that YouTube is the second most browsed website in the world?
Maybe your business has already set up a YouTube brand account and uploaded a few videos. If those videos have any kind of engagement, whether that be views, comments, likes, or dislikes, you have a world of analytics to explore. There’s also the opposite possibility of having absolutely no engagement. This is where understanding YouTube Analytics comes in handy.
YouTube Analytics is the heartbeat of your channel. This tool helps you to see what’s working and what isn’t. By accessing your analytics, you can understand who your audience is, what they like to watch, and use the data to inform your next YouTube marketing campaign.
No matter if you’re getting thousands of views or only a few, knowing how to read and understand your analytics is crucial when developing a YouTube marketing strategy. In this article, we’ll talk about where you can access your YouTube analytics, how to read them, and why they’re important.
Need more information about something specific? Jump ahead to:
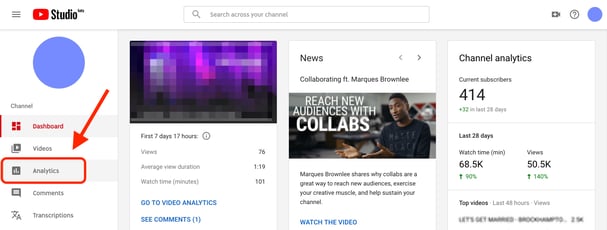
To access your YouTube Analytics, first, navigate to your channel and click the YouTube Studio button at the top of the page.

Once on your dashboard, you’ll see a sidebar on the left-hand side of your screen. You’ll want to click on the Analytics tab.
You’ve reached your Channel Analytics homepage. There’s a lot going on, so let’s start at the top.
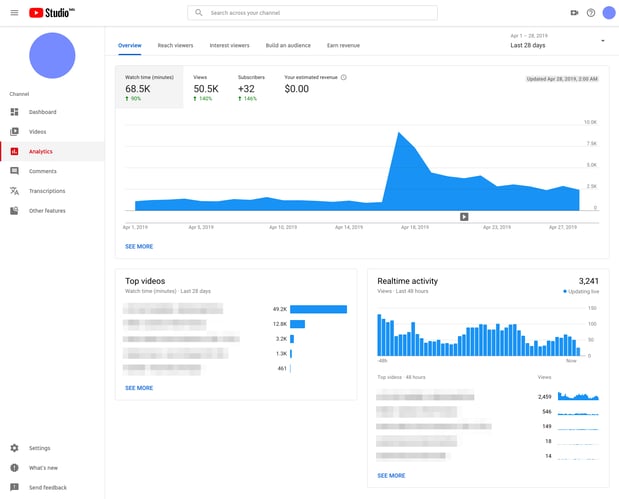
Lining the top of the page are a few basic metrics that YouTube has already tracked. These include Watch time, Views, Subscribers, and Your estimated revenue.

The percentages in green showcase the difference month-over-month. For our example, we can see that our watch time has increased by 90% and our views have gone up by 140%.
When you click on these metrics, the graph changes to show your channel’s progress. Keeping track of this data on a monthly basis is a great way to monitor how successful certain campaigns are.
These metrics at the top are a high-level view of your channel and the engagement it’s receiving, but there’s much more to see.
Let’s talk about the Channel Analytics homepage. Although we’ve already gone over the metrics at the top, we can go deeper. Now, click SEE MORE.
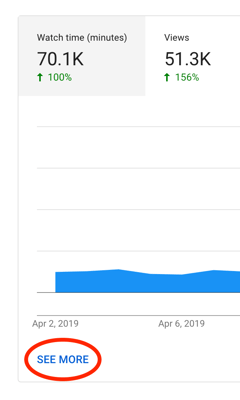
This is what your screen should look like.
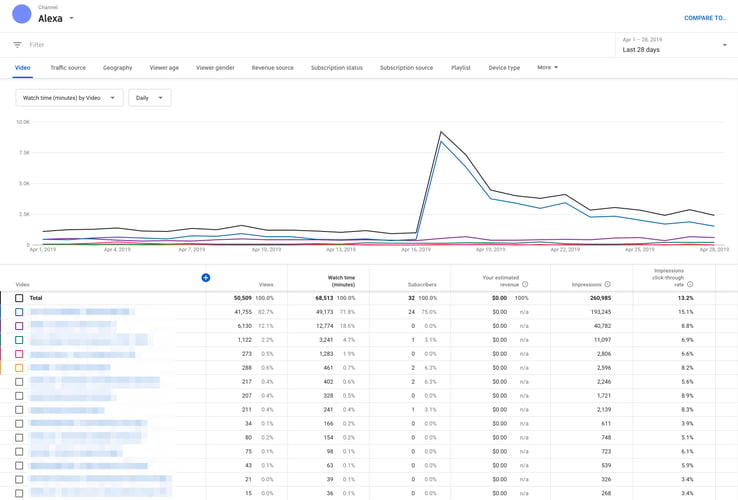
There’s a lot of useful information on this page. Every single one of your YouTube videos is listed here broken down by views, watch time, how many subscribers the video earned, impressions, and impressions click-through rate. The first video listed is your most successful video, the second being the second most successful, and so on.
It would be a good idea to bookmark this page to track your videos’ progress as you continue to post to YouTube. These metrics show how successful each video you share is. Maybe you post a video of your product or service in action and notice how many views it received and how many people subscribed because of it. You could create a similar video to capitalize on this success.
| Read More: Find out which of your favorite channels made the cut for the top 10 most subscribed YouTubers. |
You can also see engagement by a specific category if you click on Watch time (minutes) by Video and select one from the drop-down menu.
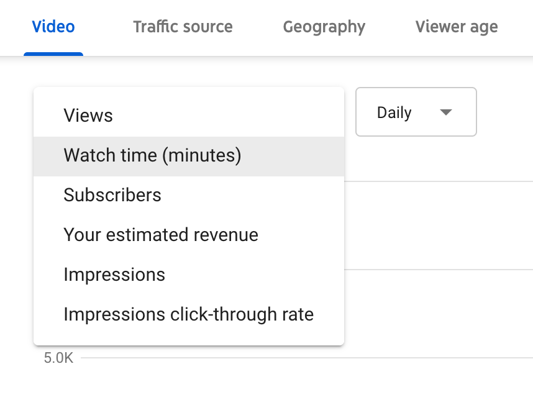
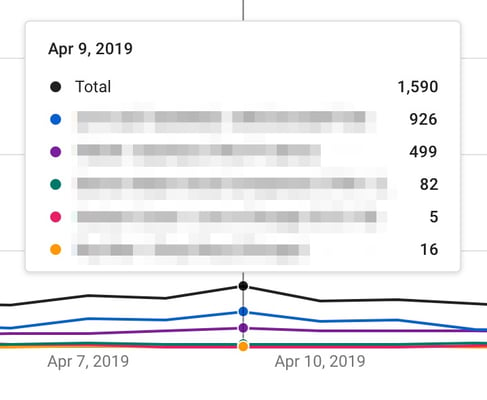
For our example, we’ll stick with watch time. By gliding over the graph, you can see how many minutes each video was watched for any specific day.
If you’d like to see how your content has been doing over a longer period of time, click Last 28 days in the top right corner and select a timeframe from the drop-down menu.

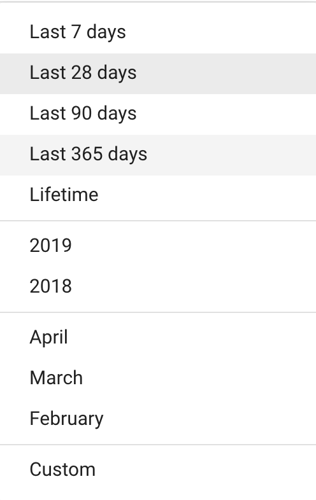
For this example, we’ll change Watch time to Views and change Last 28 days to Last 365 days.

Looking at your analytics for the past year can give you unparalleled insight as to how certain videos perform month-over-month or how some videos may become relevant again months later. Say you’re a tech company that hosts an annual conference and you share a recap video in 2017. That same video may see engagement the weeks before and after the event in 2018. This is a great way to create content that is sustainable over multiple years.
At the top of the page, there are even more metrics for you to explore (yay)!

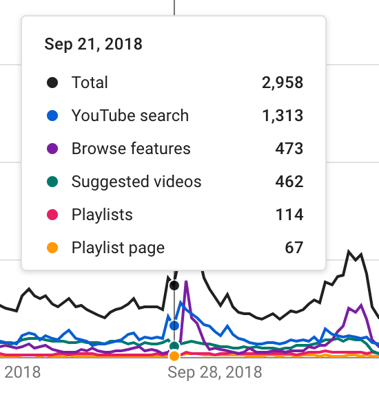
You can learn a lot about your audience by spending some time exploring each tab. If you click on Traffic source, you can see how your videos are being discovered, whether that’s as a suggested video, on the YouTube search page, or in a playlist. We’ll talk about this more in-depth later on.
If you click on Geography, you’ll be shown where your videos are being watched. This data is super important. If you know that 54% (the majority) of your audience is from the United States, you wouldn’t waste your time placing your YouTube ads on videos being watched in Poland (making up only 0.3% of your views).
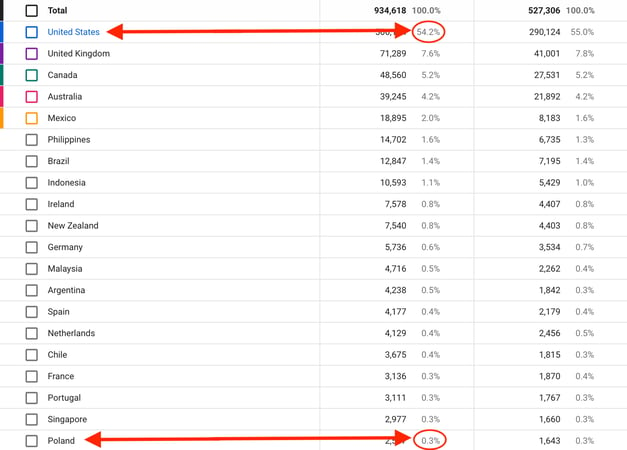
These analytics save you time and money. Make sure to take some time to explore all the data that YouTube provides. By continuously referencing your analytics, you’ll understand your audience more thoroughly and be able to share more content you know they’ll enjoy.
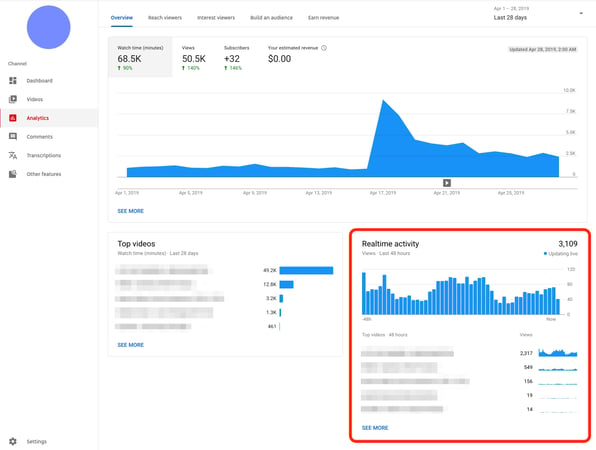
We’ve covered the basic metrics you can track to understand how your content is doing on YouTube, but let’s navigate back to the Channel Analytics homepage. Once there, click on SEE MORE below the Realtime activity section.
On this page, you’ll see all your videos listed, their publish date, and how they’ve been performing the last 48 hours, as well as their activity in the last 60 minutes.
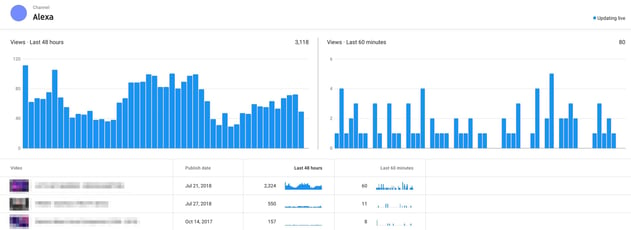
These are literal live analytics. If you share a video and want to monitor how well it’s doing within the first couple days of uploading, you can come here and watch your analytics develop in real time. Maybe you’re replying to comments the first day of posting and notice that engagement dropped off after you stopped interacting with the commenters. You can note this for next time and reply to comments consistently as they are posted.
Check out our social media marketing hub to learn even more about social analytics.
Back on the Channel Analytics homepage, we’re going to discover where your audience comes from. Click on Reach viewers.
At the top of the page, there’s a graph that displays Impressions. You can change this parameter by clicking on any of the other options at the top.
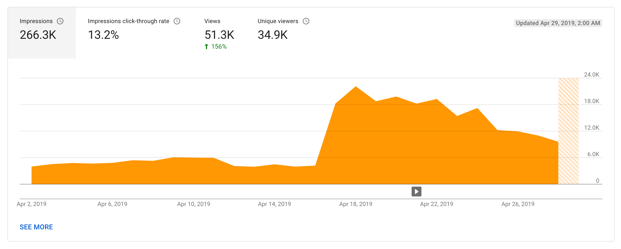
This graph will show your Impressions engagement over time. The small play button icon even shows you when you posted a video and how well that video performed.
Just like before, you can change the category or timespan at any time to view a different set of analytics. Just like Facebook Analytics, YouTube informs you of how many Unique viewers have watched your content. Keep an eye on this number and make sure it’s steadily increasing.
Below this orange graph, YouTube provides you with a boatload of stats that let you know how your audience found you.
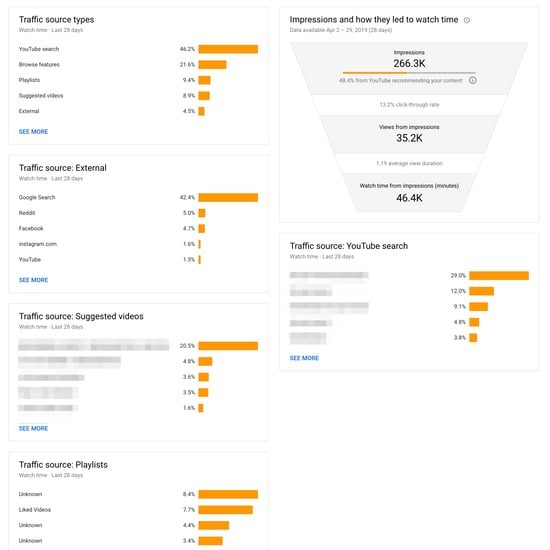
Here, you can determine the way that people discovered your videos. This could be through the YouTube search bar, browse features, suggested videos in the sidebar, curated playlists, etc. You’ll also be able to know what external source they came from (if they were redirected from somewhere else). They may have come from Instagram or Facebook. These analytics tell you that your audience is on other social media platforms separate from YouTube. It would be wise to take note of where they’re coming from and advertise there, too.
One of the most interesting analytics in this section is the Traffic source: Suggested videos box and the Traffic source: YouTube search box. Respectively, these boxes will tell you exactly where your viewer came from. The suggested videos box lets you know which video they were watching before clicking on yours, while the YouTube search box lists things your viewers have searched before clicking on your video.
These stats are hugely important! If you notice that your viewers are watching a certain influencer before clicking on your videos, it could be a good idea to reach out to that influencer and suggest working together. This could spark the start of an influencer marketing campaign, which could boost your views and numbers significantly.
Little details like this are what matters when tracking your YouTube Analytics. If you know what your viewers are watching, how they’re finding you, and where they’re coming from, you’ll know how to better target them when advertising on the platform.
Now that you've been bitten by the data bug, explore all the social media analytics software you can use to track your metrics.
Although we went over quite a few metrics you could track, there’s still much more to analyze. If it’s your first time looking at your YouTube Analytics, choose the metrics that make the most sense for your business to track and check them every week. Take the time to click around and discover all the data that is available to you. The more you monitor the data, the better you’ll be able to understand where your audience comes from, what content they enjoy most, and how they interact with videos online.
Curious about all the data you could be analyzing on other social platforms? Read up on Twitter Analytics and Instagram Analytics.
Alexa is a former content associate at G2. Born and raised in Chicago, she went to Columbia College Chicago and entered the world of all things event marketing and social media. In her free time, she likes being outside with her dog, creating playlists, and dabbling in Illustrator. (she/her/hers)
YouTube has made content creation and sharing simpler.
 by Sagar Joshi
The first thing you need to know is that YouTube Red doesn’t exist anymore.
 by Alexa Drake
How do you spice up your standard WordPress blog?
 by Mara Calvello
YouTube has made content creation and sharing simpler.
 by Sagar Joshi
The first thing you need to know is that YouTube Red doesn’t exist anymore.
 by Alexa Drake


