

If a product is being sold but there’s no one around to buy it, does it really exist?
Supply and demand is the give and take of microeconomics. The market would not survive if companies did not provide a product and consumers did not buy those products.
A market is essentially any place where suppliers and buyers meet to give and receive goods and services. These market price transactions are considered ethical because those involved are agreeing to adhere to the unspoken rules of the transaction where the seller is happy to accept the money and the buyer is content with paying the given price. Both parties have agreed on the value of the good or service and are making a clean trade.
Supply is the amount of product that a company can provide to customers at a specific price. Demand is the customer’s desire to purchase the product at that price.
Supply and demand work together to create a balanced and competitive market. They are fully reliant on each other to cultivate a consumer and distributor environment that is constantly and efficiently buying and selling.
Although supply and demand work closely together, they are also different concepts that move in unique ways depending on changes in market trends and conditions.
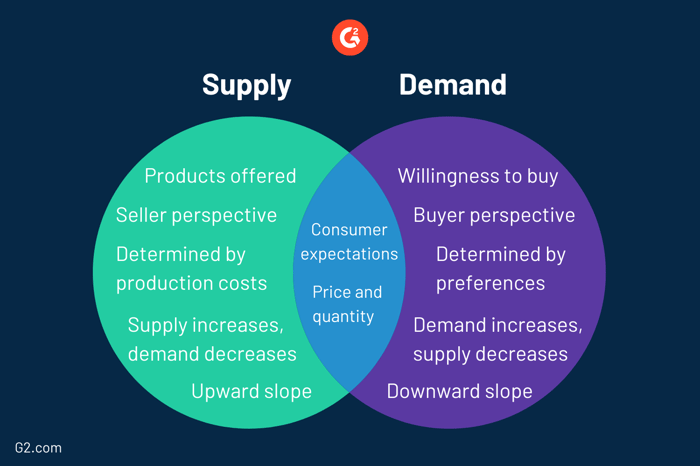
With all of those differences in mind, supply and demand do share a couple of similarities. Both supply and demand are dependent on consumer expectations. Whether a good or service is successful is fully determined by the buyer’s eagerness to pay for it.
Both supply and demand respond to changes in price and quantity. Increases or decreases in price and quantity will heavily affect the amount of supply made and the number of products demanded. This correlation can be demonstrated using supply and demand curves.
The supply and demand graphs demonstrate the relationship between price and quantity with a company’s supply and demand. The curves used on the graph show the direct result of any major changes. When there is a demand or supply shift, the curve moves accordingly and the laws of supply and demand apply.
Source: QUICK SPROUT
A supply curve on a graph shows the relationship between the amount of supply a company offers and the cost of their goods or services. It is a visual representation of how much more a product will cost to produce at a range of quantities demanded.
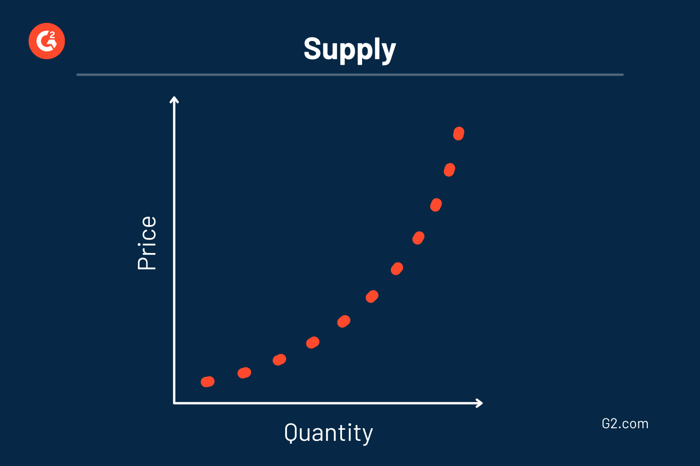
Price is shown on the vertical axis and quantity is shown on the horizontal axis with supply being illustrated using an upward slope. The upward slope demonstrates how expenses react when more or less product is needed. When more money is being spent, more profits are anticipated because the supply is being made to meet expected demand.
The laws of supply and demand, discovered by Adam Smith in 1776, study the product of how things change on the supply and demand graph. The law of supply states that when there is a price increase, there should be an increase in quantity as a result. Moreover, when there is a price decrease, there is a decrease in quantity. This is considered a direct relationship because the price and quantity supplied move together on the graph.
The price elasticity of supply allows us to determine how the quantity of a good or service reacts to when a given price changes. Economists consider a supply curve elastic when a higher price increases the amount of product supplied dramatically. When that increase is minuscule, the supply curve would be considered inelastic.
A demand curve on a graph shows the relationship between the number of supply consumers are requiring and the price of a good or service. It represents how much of a product the target audience will need or want at a range of prices.
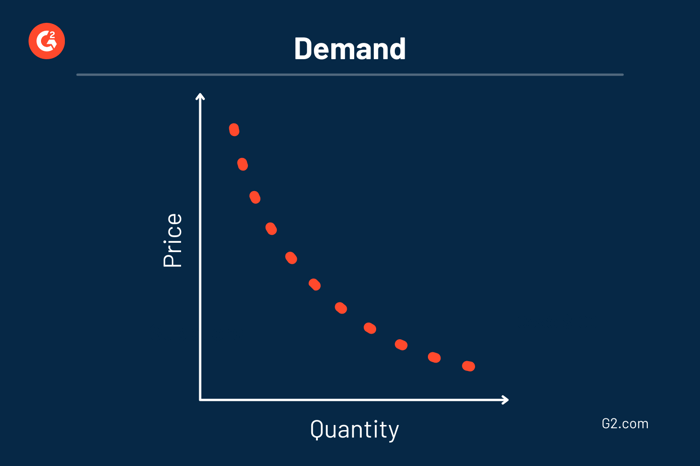
Price is shown on the vertical axis and quantity is shown on the horizontal axis with demand being illustrated using a downward slope. The downward slope demonstrates how the quantity of products demanded reacts when the price is changed.
The law of demand states when there is a price increase, consumer demand decreases. Moreover, when there is a price decrease, consumer demand increases. This is considered an inverse relationship because price and quantity demanded move in opposite directions on the graph.
The price elasticity of demand allows us to determine just how much of an increase or decrease demand is expected to yield. Economists consider a demand curve as elastic when the price increase reduces the amount of product demanded dramatically. When the reduction is minuscule, the demand curve would be considered inelastic.
A company’s market equilibrium price is where the quantity of product supplied meets the quantity of the product demanded. This equilibrium price is the only part of the supply and demand graph where the price can remain constant.
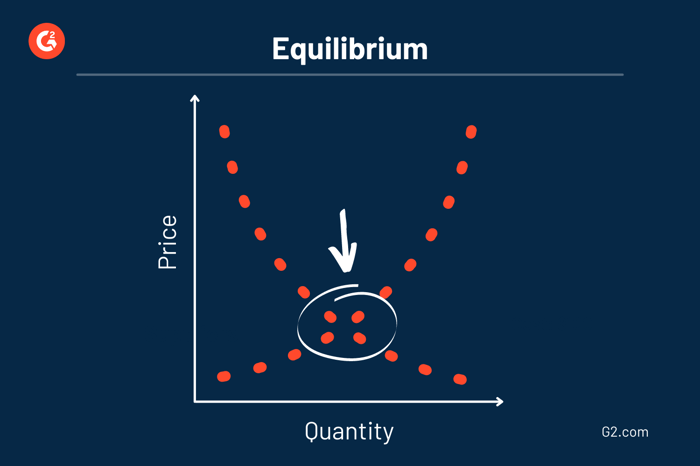
Reaching market equilibrium allows companies to offer a product price that matches the consumer’s budget at a reasonable production cost to them.
When a price rises too high, companies can be left with higher than expected quantities. This excess supply is considered surplus and is shown anywhere above the equilibrium point on the graph. To reach market equilibrium during a surplus, a company will lower its price to create more demand. As a price falls, so does the product surplus.
Offering a lower price than market competitors is not always going to help a company meet equilibrium quantity though. Pricing too low will create a demand that is higher than anticipated. Having too much demand and insufficient inventory to offer is considered a shortage. A shortage can be shown anywhere below the equilibrium point on the graph. To reach market equilibrium during a shortage, a company will offer its product at a higher price to make demand less overwhelming.
Tip: Suppliers can use pricing software to experiment with different pricing strategies and identify which one will help them achieve market equilibrium.
Equilibrium is reached when the seller can provide a number of goods that is favorable to them and there is a consumer market that is demanding that quantity of goods and gains marginal utility from securing a specific amount. When a supplier can offer that ideal quantity, they will implement a demand generation strategy to create interest in their goods or services and the supply and demand cycle continues.
Balancing supply and demand and reaching equilibrium is not as easy as it sounds. Even some of the biggest players in the industry have dealt with shortages and surplus.
Check out some real-world examples of how changes in supply and demand have affected popular companies.
One company that has found itself in the pickle of too much demand than they can supply is Apple. Due to the COVID-19 lockdown in 2020, more people than ever were making the switch to a fully digital working environment. Companies and their employees alike were trying to buy more computers and devices, and they needed them quickly. These consumers turned to Apple and skyrocketed the demand for products such as Mac computers and iPads.
However, like everyone else, Apple simply couldn’t have predicted this large influx in demand. Not only did the lockdown drive demand to heights they weren’t ready for, but it also caused significant delays in manufacturing and distributing. As a result, Apple was left with a major shortage of devices and an estimated decline of 21% YoY in computer sales.
While the COVID-19 pandemic offered some companies overwhelming demand, others were faced with particularly underwhelming demand. The lockdown and subsequent changes in how we live daily life caused people all over the world to start prioritizing needs over wants.
Due to this shift, the automotive industry saw a huge decrease in demand for new vehicles. Car brands like Chrysler, Dodge, and Buick saw major decreases in demand for their 2020 car models and were left with a surplus at the end of the year. In this time period, Ford was found to have the largest surplus with 48.9% of their 2020 inventory still remaining.
A company that has found long-term success through supply and demand equilibrium is McDonald’s. The fast-food chain is notorious for changing things up to excite and entice customers while remaining extremely loyal to their original business model.
McDonald’s does this by leveraging their knowledge of their consumer base.
As a result of the increasing importance put on being environmentally conscious, McDonald’s began implementing sustainable packaging and more organic ingredients. They even plan to start utilizing the budding success of artificial intelligence in their drive-thru systems. Although these additions will create higher costs for them, McDonald’s found that the return on investment was favorable because they were creating more authentic products and adapting to customer priorities and expectations.
When it comes to supply and demand, it is all like a game of seesaw. When something increases, that means something else is decreasing. While there are always many internal factors to consider when trying to balance supply and demand, external factors play a larger role than you think. Reaching equilibrium is not easy and many companies opt into using supply chain management or demand planning tools to aid in the process.
Whether you automate your supply and demand process or do it yourself, planning is everything. Leverage historical data to forecast future demand and organize supply accordingly. The last thing you want is to be stuck with a surplus or stressing over a shortage. The key is balancing and studying the causes and effects of your business.
Because when they said what goes up must come down, they were talking about supply and demand.
Ready to leverage a supply and demand model in your business process? Start by digitizing your entire supply chain using specification management!


Instead of giving credence to fear-mongering books and films about artificially intelligent...
 by Rebecca Reynoso

Like many other high tech advancements, IoT is at the forefront of innovation.
by Rebecca Reynoso

Social media is an integral part of most people’s lives. And as we all know, anything posted...
by Rebecca Reynoso