

When it comes to buzzwords used by businesses, analytics has got to be at the top of the most-used list.
Thanks to the internet and the numerous ways technology is evolving, analytics and data mining have never been more crucial.
And while data is great, it's what’s done with it that can make or break a company. Analytics platforms help ensure data is prepared and organized to improve decision-making.
That's also where business analytics comes in.
Business analytics (BA) is the process of using data, statistical models, and analysis tools to identify patterns, make predictions, and inform business decisions. It includes data mining, predictive modeling, and data visualization.
When used correctly, BA can be leveraged to accurately predict future events related to consumer actions, market trends, and assist in creating more efficient processes that can lead to increased revenue.
There are a lot of moving parts that go into business analytics, but it may be unclear why BA is important to your organization in the first place.
For starters, business analytics tools help a company understand the need to make accurate decisions. These decisions are likely to impact your entire organization as they help you to improve profitability, increase market share, and provide a greater return to potential shareholders.
There’s no denying that technology has a significant impact on many businesses, but when used correctly, BA has the potential to positively impact your company, providing a competitive advantage to a variety of companies.
While some companies are unsure what to do with large amounts of data, business analytics works to combine this data with actionable insights to improve the decisions you make as a company.
Additionally, since this data can be presented in any format, the decision-maker at your organization will feel informed in a way that suits them and aligns with the goals you set at the beginning of the process.
Essentially, the four main ways business analytics is important, no matter the industry, are:
One method isn’t more important than another; it all depends on what your end goal is when using BA. When you use these four types of analytics, your data can be cleaned, dissected, and absorbed in a way that makes it possible to create solutions for no matter what challenges your organization may face.
Deciding which method to go with will depend on the business situation at hand.

Now that we’ve narrowed down how it works, let’s now break down all of the components that go into business analytics and which methods it uses to find its valuable conclusions.
The method you decide to go with when taking a deep dive into BA is going to depend on the end goal you set before starting the process. Whichever method you choose, you are sure to find actionable insights waiting for you at the finish line.
Data mining is the strategy of sifting through massive datasets to uncover patterns, trends, and other truths about data that aren’t initially visible using machine learning, statistics, and database systems. There are several data mining techniques that business analytics can pull from, including regression, clustering, and outlier detection.
This is a useful element of business analytics as it leads to faster and more efficient decision-making.
For example, through data mining, a business may be able to see which customers are buying specific products at certain times of the year. This data can then be used to segment those customers.
Text mining is the process of extracting high-quality information from the text on apps and throughout the World Wide Web.
Companies use text mining to collect textual information from social media sites, blog comments, and even call center scripts. Then, this data is used to improve customer service and experience, develop new products, and review the performance of their competitors.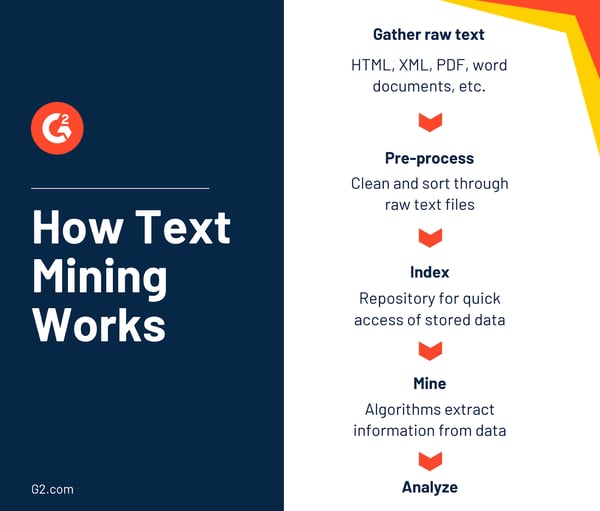
The process of data aggregation consists of gathering and collecting the data, which is then presented in a summarized format. Essentially, before it can be analyzed, it needs to be collected, centralized, cleaned, and then filtered to remove any inaccuracies or redundancies.
This is a crucial step for business analytics because the accuracy with which you can gather insights from data is directly related to the kind of relevant and actionable results you’ll have at the conclusion of the process.
An example of data aggregation is how a marketing team utilizes data such as customer demographics and metrics (age, location, number of transactions, etc.) to personalize their messaging and offers.
When business analytics are used to analyze processes that occurred during a specific period or season, businesses are provided with a forecast of future events or behaviors, thanks to historical data.
Forecasting can be used for several different things, such as retail sales around specific holidays and spikes in specific internet searches around certain events, like an award show or the Super Bowl.
Jackie Jeffers, Analytics Strategist at Portent, stresses the importance of using forecasting as a major part of your strategy. "Forecasting based on historical data is useful for setting yearly goals and predicting online user behavior, such as traffic and conversions. Customer journey analytics allow you to identify first-touch interactions with a potential lead, all the way to the conversion step. Having visibility to all touch-points in the nurture process lets you optimize the steps in between and improve the user journey."
Not only does business analytics help build your lead funnel, but it also impacts your bottom line in other ways. Forecasting call volume, for example, can help optimize staffing resources in a call center. Having the ability to gather and analyze data is not only beneficial but critical to making data-driven and informed decisions."
For all you visual learners out there, data visualization is an absolute must-have part of business analytics. It seamlessly takes the information and insights drawn from your data and presents them in an interactive graph or chart.
The right data visualization software is crucial to this process to help track business metrics and KPIs in real-time so you can better understand performance and goals. If you’re unsure which software option is right for your company, take a look at the hundreds of unbiased reviews brought to you by G2!
Related: Learn more about the 67 types of data visualizations your business can use to
Business analytics has use cases in a wide array of industries and organizations. As technology becomes more advanced, more and more companies are developing new ways to utilize big data to their advantage to maximize their profits and improve the customer experience.
For instance, let’s say you run a fast-food restaurant.
You may use business analytics to speed up the ordering process for your customers using the drive-thru. When you use BA to monitor the traffic that the drive-thru receives, you’ll be able to know your peak hours and when to increase efficiency.
When you know the line is about to get long, you can move around your staff to get more employees working the drive-thru lane, or even have them recommend orders that can be completed quickly. When lines are shorter, employees can recommend items with higher margins that are more expensive and take more time to create.
The popular meal kit delivery service, Blue Apron, used business analytics to forecast demand for its orders and recipes. Each week, they sent their subscribers a mixed menu of meals for purchase, and thanks to predictive analytics, they were able to use various data insights to avoid product spoilage and fulfill orders.
To do this, Blue Apron looked at customer-related insights that consisted of historical data on how often a customer made specific orders. There was also recipe-related data that focused on a customer’s preference for recipes in the past. Finally, they examined seasonal trends to determine if there were purchasing patterns of higher or lower order rates at specific times of year.
Thanks to predictive analytics, Blue Apron was able to better understand its customers, improve the user experience, predict shifting preferences, and even identify how tastes in meals change over time.
The Growth Hackers's CEO, Jonathan Aufray, took the time to share how they use business analytics. "At Growth Hackers, we use business analytics to track our traffic sources and the number of leads we generate. This allows us to understand which marketing strategies work and which ones don't, allowing us to optimize the least performing ones, drop some, and double down on the marketing channels that give the best results."
We also use business analytics for the clients we help. It's essential to be able to track your actions and gather data in order to keep improving your strategies. Without data, you cannot know what's working and how to optimize your strategy. I believe that all businesses should use analytics for their marketing, lead generation, sales, and customer experience.
Enterprise analytics teams often evaluate business analytics tools alongside broader analytics platforms. Here's how the highest-rated analytics software for enterprises compares across key dimensions on G2.
Business analytics has many use cases, but when it comes to commercial organizations, BA is typically used to:
No matter the size of your business or the industry in which it operates, business analytics provides a variety of benefits.
When you utilize BA to your advantage, you’ll have a competitive edge over the competition, no matter your industry.
Business analytics has some potential pitfalls that you’ll need to overcome.
Implementing the right business analytics strategy isn’t something a company can do overnight. However, when specific best practices are put into place, you can be sure that the insights you receive allow your business to be as successful as possible. These best practices include:
When you take the time to do these practices, you can be sure that your business will benefit the most from data-driven decision-making.
Check out how G2 reviewers rated some of the analytics software tools for different attributes:
Additionally, some of the highest-rated features include:
A career in business analytics is a popular choice among those who enjoy working with numbers. To start working towards a career in BA, you’ll need a bachelor’s degree in business analytics, data science, information management, business intelligence, marketing, statistics, or a related field.
Some of the more popular career paths related to business analytics are:
If you need a place to start within the business analytics industry, one of the more common paths is the role of a data analyst. There’s no denying that this job is in high demand, especially when you consider that every organization is beginning to see the value a data analyst will add to their staff.
 Source: 365 Data Science
In order to have a career in one of the roles listed above, you’ll need a specific skill set to succeed.
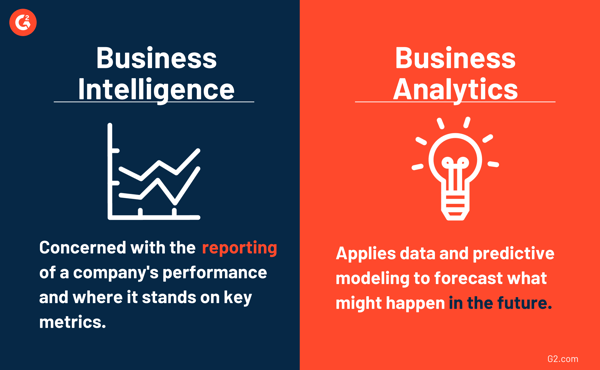
It’s not uncommon that business intelligence (BI) is often confused with business analytics, and vice versa, as the two are similar. BI also deals with historical data, but this data tends to be compiled from various places, like a company’s CRM software, ERP systems, and marketing automation tools.
With both BA and BI, data is collected, sorted through, and displayed using data visualization software so that business executives can have a visual representation of any spikes or pain points that may be uncovered.
However, there is one main difference between the two:
Business intelligence is more concerned with reporting a company’s performance and where it stands on key metrics. It provides context to what happened in the past, why it may have happened, and what is happening now.
Business analytics takes the context provided by business intelligence and applies statistical analysis, data mining, predictive modeling, and other techniques. These methods are more advanced, and they’ll provide more context of what to expect in the future – also known as forecasting.
It can be tricky to determine which method is right for your business. Use business intelligence if:
On the other hand, use business analytics if:
Related: Unsure where to start with turning your data into actionable information? Browse your options for business intelligence software and read real reviews from your peers on G2!
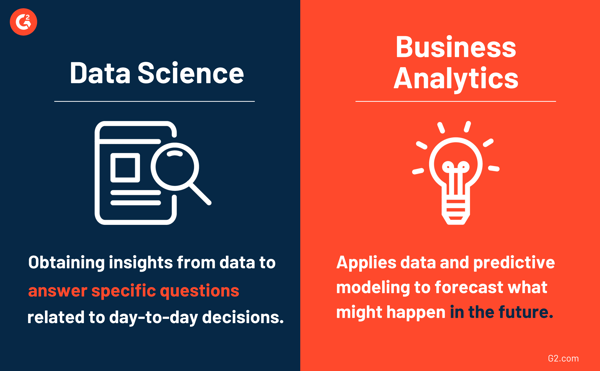
Like business intelligence, sometimes it’s unclear how business analytics differs from data science. Both involve gathering data, modeling, and obtaining various insights.
The difference between the two stems from BA being specific to business-related problems, like cost and profit, and can predict what could happen in the future.
Data science is the larger or superset of the two, as its main focus is to answer questions related to customer preferences, seasonal factors, and geography within the business. It combines data with algorithm building and technology to answer these questions.
In short, data science is the science of studying data using statistics, algorithms, and technology. BA is the statistical study of business data.
Let’s consider a real-life example.
Let’s say you open up an ice cream store. You buy all of the necessary ingredients and equipment, and even come up with a catchy name.
Business analytics will help you answer questions like:
Data science can help you answer questions like:
Got more questions? We have the answers.
Yes. By analyzing customer behavior, feedback, and interaction data, business analytics helps personalize experiences, predict churn, and improve satisfaction.
No. Small and mid-sized businesses can also benefit by using lightweight tools to analyze sales, operations, and customer data to make informed decisions.
Not always. Many business analysts use low-code or no-code tools, though familiarity with SQL, Python, or R is helpful for more advanced analysis.
It depends on the scope and maturity of the program. Many organizations see initial insights within a few months, with stronger ROI over time as models mature.
Start by identifying a clear business goal, such as increasing sales or reducing churn. Then, use free or low-cost tools like Google Sheets, Google Looker Studio, or Power BI to analyze existing data. Focus on a single high-impact use case and expand gradually as you gain insights.
Key trends include the rise of self-service analytics tools, real-time data processing, AI and machine learning integration, cloud-native analytics platforms, and a growing focus on data privacy and governance.
Evaluate tools based on ease of use, data integration capabilities, scalability, cost, and whether they support both real-time and historical analysis. Choose a platform that matches your team’s technical skills and your business's data maturity.
Track metrics aligned to your goals. For example, revenue, profit margin, and customer acquisition cost for financial performance; churn rate and NPS for customer insights; and conversion rate and ROI for marketing effectiveness.
AI is making analytics more predictive and prescriptive by automating insights, detecting anomalies, and suggesting actions. It’s also enabling natural language queries, making data exploration easier for non-technical users.
When your organization chooses to use business analytics, you are bound to make better decisions regarding revenue, customer experience, and overall efficiency.
These methods are often considered a hidden gem as they can reveal ways to get an edge over your competitors. Set your goal, keep your eye on the prize, and you’ll be pleasantly surprised by what you find.
Ready to choose the right tool for your business? Explore G2’s top-rated analytics platforms, compare features, pricing, and reviews to find the best fit.
This article was originally published in 2020 and has been updated with the latest information.

There are many types of analytics today, each showing a different picture to help drive change...
 by Devin Pickell

Curious about the secret language of AI?Words, sentences, pixels, and sound patterns are all...
 by Sagar Joshi

.png)