Print, television, Google, Facebook, Instagram, TikTok, email, video, audio, apps, websites - the list of advertising channels today is endless .
With so many options, where will you spend your advertising money to reach the right audience? Should you go for the traditional print ad or go for a Facebook ad? Or maybe even try TikTok video? Or maybe you could use cross-channel advertising platforms to run ads on most digital media.
Add to this the challenges of limited budget, time, competition, and, most importantly, the difficulty of capturing and holding people’s attention. How would you run a profitable ad campaign?
Advertising isn’t just about creating eye-catching campaigns; it’s about crafting strategies that resonate with your audience and drive measurable outcomes. Luckily, we’ve outlined current advertising trends backed by data to help you build a winning advertising strategy for your business.
Top advertising statistics for 2025
- 69.1% of advertisers and marketers have already integrated AI into their operations.
- 36% of social media users say short-form videos have the highest return on investment compared to any ad format.
- 32% of marketers use AI to create, run, manage, and optimize their ads, with the total figure likely to increase in 2025.
- 87% of CMOs believe that AI represents the future of advertising and marketing.
- Video ad spend is projected to reach over $240 billion by 2028
With consumer expectations evolving and digital signage platforms continuously expanding, now is the time to revisit how your advertising efforts can deliver more impactful results. Let’s dive into some data that will help you consistently perform and innovate.
Global ad spend statistics
The advertising industry is growing despite the economic uncertainty, and the momentum is set to continue next year with several big events lined up, like the Paris Olympics and Paralympics, UEFA Euro, and the US presidential election.
- Global advertising spending will reach an estimated 917 billion U.S. dollars in 2024, up from 845 billion dollars a year earlier.
- The annual value is projected to expand, surpassing 1.17 trillion dollars by 2028.
Understanding which channels advertisers allocate their budgets is essential for industry professionals and businesses aiming to make informed advertising decisions for the year. From traditional platforms like TV and display ads to digital frontiers, these numbers shed light on the strategies and preferences shaping the advertising ecosystem.
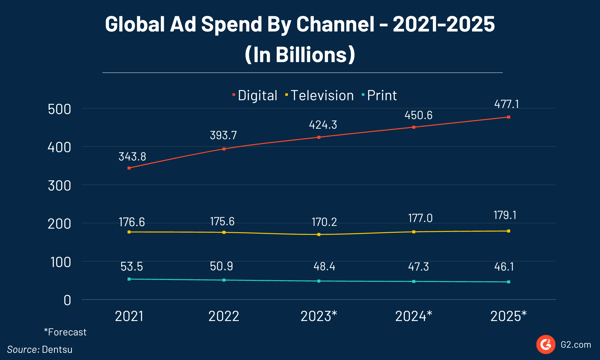
- Digital ad spending is forecast to grow by 7.8%- more than double the total market rate – to reach $424.3 billion in 2023.
- Emerging digital categories like retail media and connected TV will grow double-digitally to 18% and 15.2%, respectively, in 2023.
- 22% of marketers use display ads as part of their marketing strategy
- Search advertising spending will expand 8.9% to $150 billion.
- Unlike digital media, TV ad spending will decline by 3.1% to reach $170.2 billion this year.
- Similarly, spending on print advertising will decrease by 5% to $48.4 billion in 2023.
- Out-of-home (OOH) advertising, which includes ad placements such as billboards, is expected to grow 13.4% to $35.6 billion in 2023.
- Digital out-of-home ad spending is forecast to rise 26.1% to $13.3 billion.
Digital advertising statistics
Digital advertising, also known as online advertising, primarily uses internet channels like web browsers, social media pages, search engines, blogs, and apps to promote products or services to the audience.
“For years now, we’ve seen the industry pivot towards digital, more than doubling investment in the last five years, thanks in part to the almost unlimited potential to reach, engage, and sell to individual consumers. ”
Peter Huijboom
Global CEO, Media - International Markets, Dentsu
Given that there are more than 5 billion internet users today, digital channels have become paramount for businesses, be it B2B or B2C, to connect with their target audiences globally. The numbers show the diverse aspects and evolving digital advertising trends.
- Digital advertising can potentially boost a brand's awareness by 80%.
- 70.5% of advertisers had more digital ad budgets in 2023 than 2022.
- A quarter of advertisers note their digital ad budget will increase by 10-40% in 2023.
- Advertisers will invest in display, social media, video, and search as the top four digital channels this year.
- Google, Spotify, Microsoft, LinkedIn, Meta, X (formerly Twitter), and Pinterest are the leading digital platforms advertisers use.
- Only 27% of total ad budgets were allocated to non-digital platforms, underscoring the dominance of digital strategies in 2024.
- Only 28% of marketers had to deal with flat or reduced ad budgets in 2024, signaling widespread confidence in technology’s role in driving growth.
Top digital ad sellers
A handful of tech companies that have built massive platforms reaching billions of people worldwide dominate the digital ad market. From search engine behemoths like Google and social media titans like Meta and TikTok to e-commerce marketplaces like Amazon, these household names hold a massive share of the digital ad market.
- Google holds the top spot in the digital ad market, with its 2023 global digital ad revenue expected to account for 39% of total digital advertising revenue globally.
- Alphabet, Google’s parent company, earned $112.7 billion in revenue from Google advertising channels in just the first half of 2023.
- Facebook follows Google with a projected digital ad revenue share of 18% in 2023.
- Amazon comes in third with an expected 7% share.
- Following these companies are players from Asia - TikTok (3%), Baidu, JD.com, and Tencent, all three with 2%.
$357 billion
Google’s projected digital ad revenue by 2026, representing 44% of the total global digital ad
Source: Statista
- In comparison, Facebook is expected to reach nearly $203 billion in advertising revenue by the close of 2026.
Search advertising statistics
The first thing we do when looking for something, be it the nearest Chinese takeaway or Apple’s latest launch, is to search it online. So, what better place for businesses to reach these people?
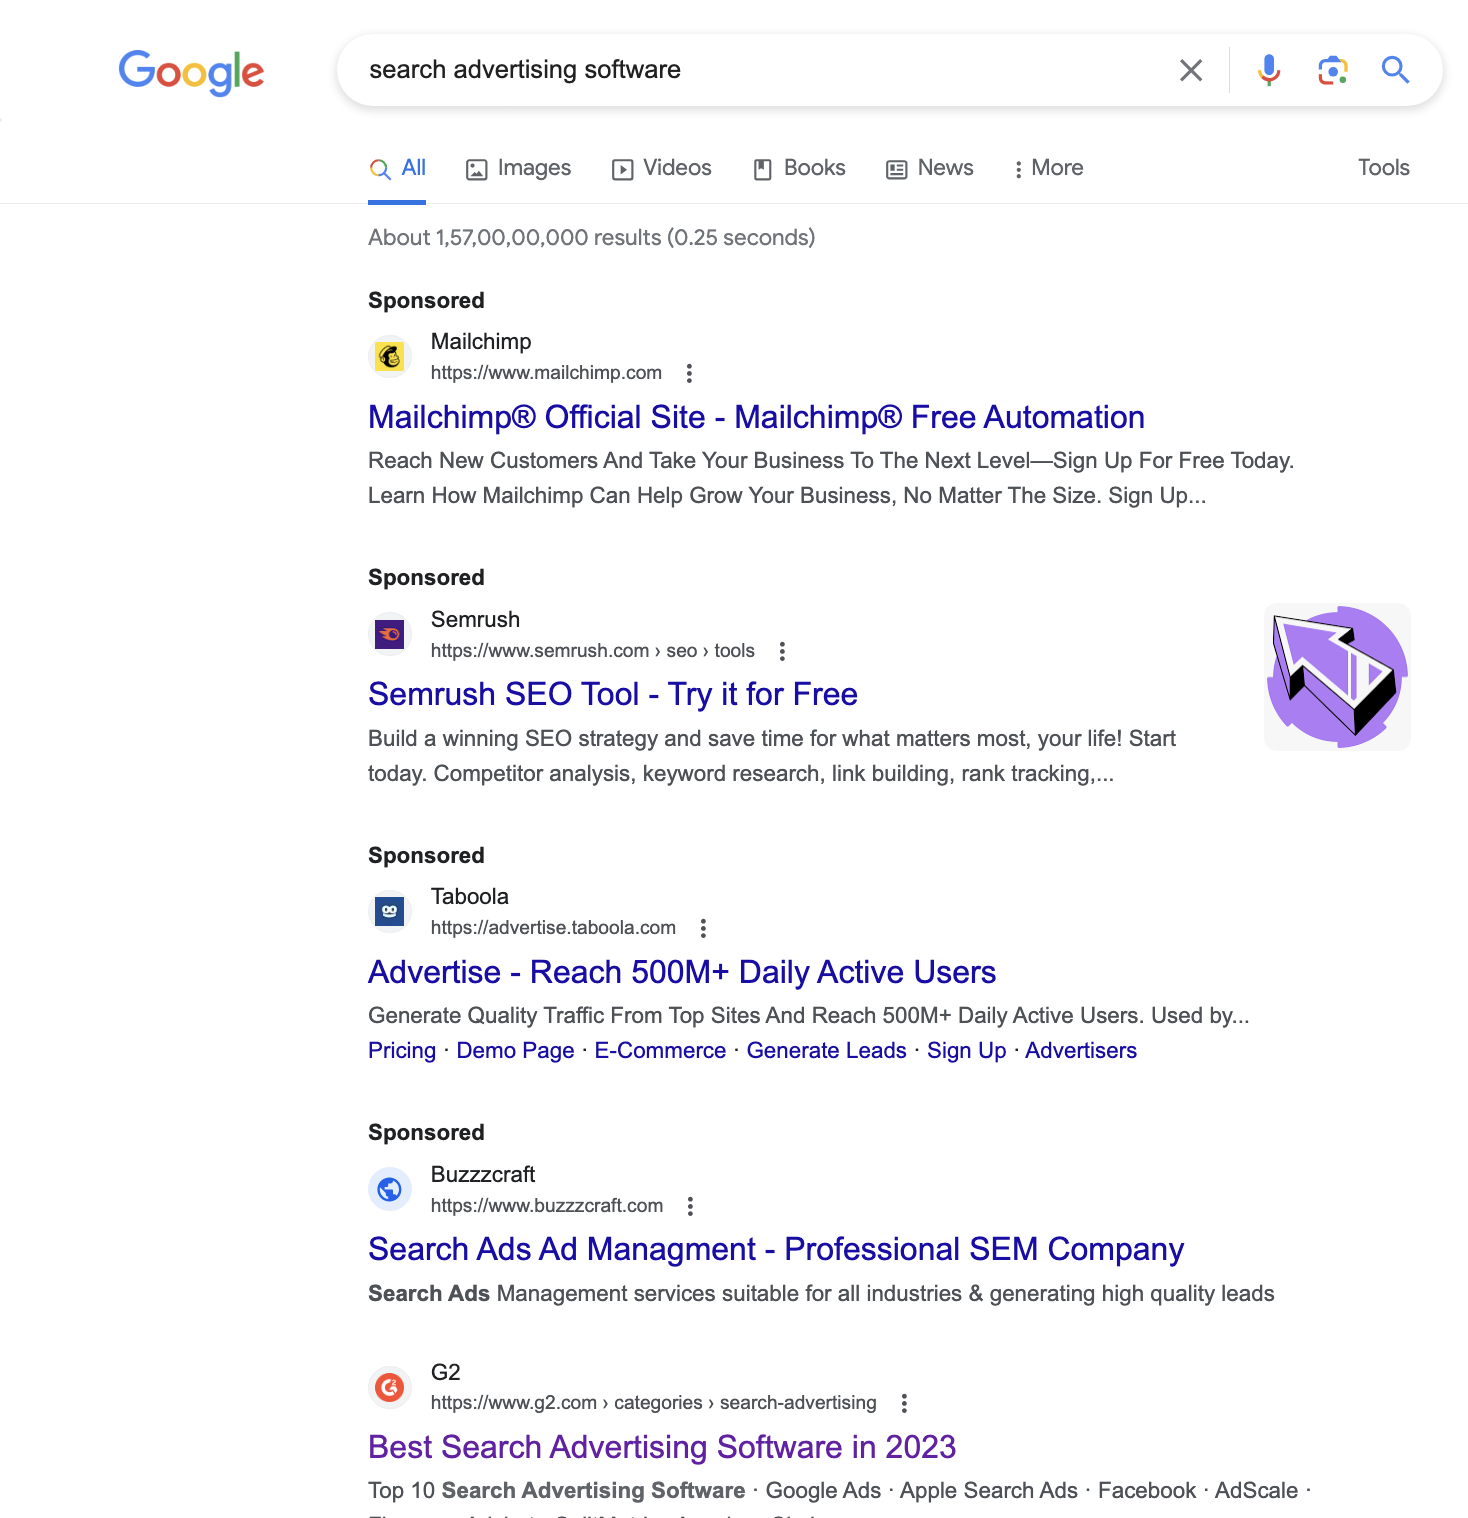
Often called paid search advertising or search engine marketing, it involves placing digital ads in search engine results. See the sponsored results in the following search? That’s search advertising.
Following are some important statistics on search advertising you need to know.
- Search advertising is the largest segment in the digital ad market, with a market volume of $202.40 billion.
- 56% of US consumers start their search when online shopping on Amazon.
- 42% of US consumers start their online shopping search on a search engine.
- Pay-per-click (PPC), which is the major part of search advertising, generates twice the volume of visitors in comparison to search engine optimization (SEO) for organic search results.
- Google Ads, the most popular search advertising platform, boasts an average conversion rate of 7.04% and a click-through rate of 6.11% in 2023.
$4.22
was the average cost per click (CPC) in Google Ads in 2023.
Source: Wordstream
What G2 data on search advertising software shows
- Smaller companies are actively employing search advertising as a crucial component of their digital advertising strategy, as they comprise the majority (63.4%) of users of the search advertising software.
- While mid-market companies (26.8%) are also substantial users, enterprise companies (9.9%) seem to have a relatively smaller presence in this segment.
Mobile advertising statistics
We live on our phones. So, it's no surprise that businesses look to target us with their ads on mobiles via mobile marketing and advertising. The text ads you get via SMS, the banner ads you see on websites on your mobile or the notifications you get on your phone when you are in a particular location, are forms of mobile advertising. Here are some important stats you need to know about mobile advertising trends.
- 7+ billion people use mobile phones worldwide.
- People, on average, spend 3.5 hours on mobile devices.
- Mobile searches make up more than half of searches on Google.com.
- $193.4bn of total ad spending will be generated through mobile in 2028.
Ads with augmented reality (AR) in mobile are seeing an upswing as advertisers recognize the unique opportunities this technology offers to engage audiences in immersive and interactive experiences.
- AR mobile ad market is estimated to reach nearly $10 billion by 2026.
What G2 data on mobile advertising software shows
- Similar to search advertising, mobile advertising is popular among small businesses, with 52.7% of mobile advertising tools users coming from the segment.
- Following them are mid-market companies, with more than a third using mobile advertising software.
- Only 14.4% of mobile advertising software users come from enterprise companies.
Video advertising statistics
Using videos to sell products and services has been popular since the 1940s, when television sets were introduced. Videos tell a story and grab viewers’ attention without being a hard sell. With the advent of streaming platforms and social media, video advertising has transcended the limitations of traditional TV and is now a staple in the digital marketing strategies of both B2B and B2C companies. Take a look at some numbers that substantiate this.
- Ad spending in the video advertising market is projected to reach $191.3bn before 2025.
- The average ad spending per internet user is projected to amount to $34.5 in 2024.
- People watch 17 hours of online videos on average every week.
- 87% of US households have a TV or television connected to the internet to stream online content.
- 90% of consumers watch videos on YouTube.
- Watching a video has convinced 89% of people to buy a product or service.
- Video ad strategy is useful for selling software, too, as 79% of people say watching a video convinces them to buy software or an app.
- 46% of marketers created video ads in 2022.
- 89% of marketers say they get a good return on investment (ROI) from their video ads.
- 91% of businesses use video as a marketing tool.
- With 90% of video marketers trusting YouTube, it is the most used platform. It’s also considered the most effective video marketing platform by 78% of marketers.
- Facebook is second at 86%, followed by Instagram and LinkedIn, both at 79%.
- Short-form video ads are growing in popularity as 66% of consumers pay 2.5 times more attention to short-form videos than long-form videos.
- Ad spending on short-form videos is expected to reach a projected market volume of $145.8bn by 2028.
- Reels, short video formats on Instagram and Facebook, exceed 200 billion daily plays across both platforms.
What G2 data on video advertising tools shows
- An analysis of G2 review data of video advertising tools shows that marketing and advertising, retail, information technology and services, computer software, and financial services are the most common industries using the software.
- Most video advertising tool users, comprising 50.2%, are from small businesses.
- Mid-market companies represent 33.6% of these users, and enterprise companies make up the remaining 16.2%.
This data again highlights a substantial interest in video advertising across business sizes, with smaller businesses taking a prominent share.
Social media advertising statistics
Consumers are increasingly spending more time on social media sites like Facebook, Instagram, and TikTok, making it inevitable for businesses to connect with them there. To this end, brands spend considerable money on paid social media promotion campaigns to harness the platform's incredible reach, engagement, and targeting capabilities.
- On average, individuals engage with seven distinct social networks every month.
- 94% of consumers engage with social platforms at least monthly, indicating the significant opportunities available for brands in this space.
- Almost 50% of Gen Z adults discovered new products or brands through influencer endorsements, and nearly a third of them bought the product.
- Six out of 10 customers expect businesses to offer customer service through social media.
- Nearly 70% of marketers utilize social media to build brand awareness.
130 million
social media users engage with shopping posts every month.
Source: BusinessDasher
- Facebook is the most-used platform by marketers worldwide at 93%, followed by Instagram at 78%.
- 52% of marketers cross-post content to multiple social platforms with as few changes as possible.
- 25% of marketers are exploring targeted social media ads, followed by collecting first-party data (25%), Google Topics API (21%), contextual advertising (15%), and universal identifiers (14%).
What G2 data on social media advertising software shows
- The most common industries using social media advertising software are marketing and advertising, computer software, IT, health, wellness and fitness, and professional training & coaching.
- Small businesses, once again, have widely adopted social media advertising, with 71.1% of social media advertising tool users coming from this market segment.
- Mid-market companies represent 22.4% of users, while enterprise-level companies constitute 6.5% of the user base.
Let’s break down some interesting statistics about advertising on some of the major social media websites.
Facebook advertising statistics
Below are the statistics that everybody looking to advertise on Facebook should know.
- Facebook is the third-most visited website, just behind Google and YouTube.
3.29 billion
is the number of monthly active users on Facebook on average for September 2024, an increase of 5% year-over-year.
Source: Meta
- A Facebook user clicks on 12 ads every month on average.
- The average cost-per-click (CPC) of Facebook ads is $0.44 across industries.
- The social media giant has over 10 million active advertisers.
- The median CTR for Facebook ads across all industries is 1.54%.
TikTok advertising statistics
Numbers show TikTok is fast rising as the place where people search first when online shopping. Here are some statistics related to advertising on the short-form video app.
- TikTok had 1.7 billion+ MAUs at the end of 2022.
- TikTok accounts for 32% of users’ social media time.
- In 2023, 19% of US consumers searched on TikTok first when shopping online, a 5% rise from 2022.
- There are an estimated over 100,000 influencers on TikTok.
23.7 million
TikTok users in the United States made purchases on the app in 2022. The number is expected to reach 39.5 million by 2026.
Source: Statista
- TikTok boasts an average engagement rate of 5.96%.
- The average CPC of TikTok ads is $1.
- TikTok ads start at $10 per 1000 views with a $500 minimum per campaign.
- 90% of branded hashtag challenges on TikTok generate 2.5X ROI on ad spend.
- Challenges with hashtags cost brands $100,000+ on TikTok.
Related: Learn about everything you need to know about influencer marketing and how to build your influencer marketing strategy.
Instagram advertising statistics
Dive into these statistics, focusing on Instagram advertising.
- Instagram is the fourth-most visited website on the internet.
- Instagram has over 2 billion MAUs as of January 2023.
- 80% of marketing professionals have Instagram in their digital marketing campaigns.
- Business Instagram accounts post an average of 1.71 feed posts on the photo and video app every day.
- The average CPC of Instagram ads ranges from $0.20 to $2.
- The typical engagement rate on Instagram business account posts stands at 0.54%.
- 35% of Instagram users will make buy on the platform in 2023.
Traditional advertising statistics
As much as digital media dominate today, traditional advertising, i.e., advertising via offline channels like newspapers, billboards, TV, and radio, is still a mainstay in the advertising world. Check out the statistics that show the relevance of these classic avenues.
- The annual spending on traditional advertising is estimated at $306.79 billion in 2023.
- The radio advertising market size reached $ 37.2 Billion in 2022.
- OOH ads have a much higher recall for consumers than other ads on live and streaming television, podcasts and radio, and print and online ads.
- Traditional billboards have an average ROI of 40%.
Television advertising statistics
With plenty of live events, such as sports, award shows, and political news coverage, people are still shelling out cable subscriptions, making television a go-to platform among traditional media for ads.
- U.S. adults watch TV for an estimated 2 hours and 33 minutes daily in 2023.
- The global TV advertising market size hit $ 227.0 billion in 2022.
- The US TV ad spending will be $67.17 billion in 2024.
- In 2022, more than 475 direct-to-consumer (DTC) brands spent over $5 billion on TV advertisements.
- In 2023, advertisers paid an average of $7 million to air a 30-second-long commercial during the Super Bowl league broadcast.
- 28% search for an item after seeing it on TV.
Nail your ad game
You’ve got the numbers showing the advertising trends for the coming days. Use this to optimize your advertising strategies, reach your target audience with creative and engaging ad campaigns, and achieve your business goals.
If you don't have the time or resources to manage your own advertising campaigns, you may want to consider working with an experienced advertising agency. They can help you develop and implement effective campaigns.
Find the best advertising agencies for your business.


 by Jess Kirkbride

 by Emily Malis Greathouse

 by Adelina Karpenkova