

Social media is essential for building your business online.
We know this already. On top of that, we also know that social media platforms drive traffic and boosts conversions. But how do you know what works? That's where social media analytics tools come in.
A social media report collects data and statistics from various social networks to identify which activities are working and which ones aren’t.
Your social team might say there are no shortcuts on the road to success. And that's really true in digital marketing, but how do you measure how effective your social media marketing campaigns are, and how do you do that without burning over a bunch of data? That's where a social media report chimes in.
A good social media report can help you manage your campaign, prove your worth to your clients and connect with followers. Let's start by defining what these reports are and their relevance in today's hyper-connected business ecosystem.
You’re a client-friendly marketer. We get it. Every month there’s a new platform that needs to be mastered, and all your peers are smartly strategizing about which channel will drive the most qualified traffic.
Social media reporting can provide a wealth of data from all those platforms. It will make it easy for you to attract new leads, nurture long-lasting customer relationships, and create content that will grow your brand awareness. Let's go a little more in depth.
The more you know about your audience, the easier it is to reach them. Analyzing your social data can help you understand your audience.
For example, you can find out when your followers are online or when they are most active. Looking at your past posts can help you see if the time and day you created content worked well for your audience too.
However, a more convenient method is to use social media analytics. Some social media channels have built-in analytics that let you do it quickly. For example, you can use the Meta Business Suite to view insights for your Facebook and Instagram business accounts.
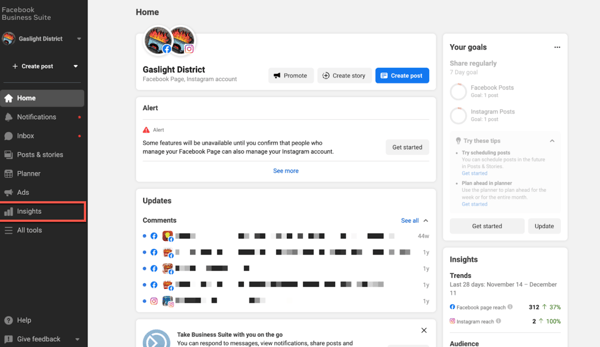
Source: AdEspresso LLC
Not all social media networks will get you the same results. And it is certainly not a good idea to conclude that networks like Facebook and Twitter will get you maximum engagement only because they have billions of users.
It doesn't get simpler than this. As a social media marketer, you will need to play around and try out different social networks, different content marketing campaigns, and using different analytics to measure your engagement, traffic, and sales.
Social media reports can help you get a clear idea of the platforms that are driving your results. Accordingly, you can choose to change your strategy to put more effort into marketing on those platforms.
There are multiple platforms through which you can access your social media accounts. While the choice is yours, it is recommended you go for a platform that would provide you with the most creative freedom.
Using automatic reporting tools, you can figure out which topics resonate with your audience, the ideal post length, and what time of the day your audiences are most active. Accordingly, you can modify your social media strategy and drive up your engagements.
To make your social media plan more effective, it is best to go to your competitors’ social media accounts and analyze their content. Are they competing for the same type of consumer? The same audience demographics? The same time zones?
Have an open mind and try to evaluate this data. This would help you get content ideas. Also, pay close attention to what trends are working well for your competitors, and study them. Then, you can build your strategies around those tactics as well.
There is no perfect formula that guarantees success. You need to identify mistakes and modify your marketing strategy to make it more effective. Through analytics, you can seamlessly figure out what’s working and what’s not.
You can also leverage social listening to improve your strategy.
Social listening helps you understand what your audience is saying about your brand on social media. This lets you remain on top of it all throughout. Accordingly, you can modify your engagement strategy to stop any PR crisis.
The report turns data into simple, easy-to-understand metrics to help you make better business decisions. It can also serve as a guide and a reference for the people in your organization responsible for managing your social media activities.
An effective report should be:
In other words, a social media report is a comprehensive way to measure and showcase your social media goals, strategy, and achievements. It will also help identify any failures, develop new strategies to attain your goals, and more.
Today's digital marketing trends are hyper-competitive. Consumer demand is changing right before our eyes. This is why knowing how to create an insightful social media report is crucial.
Whether your business is a global brand or a small retail store, every company needs to understand how its social media strategies are panning out. Creating a social media report is not just about figuring out which posts performed the best. It’s also about converting data into actionable items. The following insights will help you create the best social media report.
Knowing who the recipient of your report is will help you choose the most relevant social media metrics to include. For example, if you work for an agency, your clients will almost certainly want to know how much revenue you drove from social media.
On the other hand, if you're an in-house social media manager, you can go deeper depending on whom you are supposed to report.
Different teams have varied requirements. A CEO may not always have the time to scroll through the reports. Therefore, you must keep your report short and simple.
There are three standard categories of reporting that you can include:
Now that you know what to capture, it’s time to determine the report format that will be best for your brand and also your recipient.
Here are some suggestions for how you can create your monthly social media report:
Now that you’ve got a handle on the report type that makes sense for your business, it’s time to think about exactly how you can keep tabs on your reports.
Are your social media goals being met? How is the campaign tracking against your original plans? What did and didn't work this month? When you have a genuine social media report handy, you'll know how to keep your goals realistic and also be able to set a few stretch goals to push your limits.
Make sure you're pulling your data at the right time. This may seem like common sense, but more often than not, it is an oversight. Many marketers don't understand what the most suitable time for data collection and reporting is.
All social networks allow you to pull data based on certain period ranges: weekly, quarterly, monthly, or annually. The most common report type is a weekly and daily report. Though it makes sense from a time perspective, you need to make sure you can pull enough data over a long period to give you reliable results.
Let's discuss a few of the elements you should be covering.
Crisis management isn’t easy, but having a report on your side will enable you to act fast and decisively. You can keep your business out of the headlines when the unexpected occurs.
The goal of sentiment analysis is to identify whether a piece of content is positive or negative. In the world of online marketing, this can help businesses track how consumers are reacting to their advertising campaigns, new products, and corporate communications. Conducting your social media sentiment analysis can bring great value to your business and provide excellent insights into the customer experience.
Social media reports are an excellent way to track and analyze data from various sources. Therefore, it should be simple and easy to understand.
Focus on the data that’s most important for your organization. Different stakeholders have different levels of understanding of the process. Therefore, give some thought to what will be useful and interesting to your readers, and then pick those metrics that best represent your strategy.
You can't expect everyone to understand what you do on social media every day; it's up to you to demonstrate the value you and your team bring. To get you started, here's a simple outline.
Tracking the right metrics is crucial. Start with a clear understanding of what data you should capture. The following questions can help you measure the impact of your social media marketing campaigns.
Your goal is to create a comprehensive view of user engagement across your social media channels. Therefore, you should be clear about the content and the limitations of reporting.
Fortunately, there is an abundance of helpful KPIs to track: impressions, click-throughs, engagements, number of sales, and much more. To truly measure your social media efforts, you must define what success means to you with respect to these KPIs.
And that’s exactly what the report should begin with. Begin with your goals, techniques, and measurements in the introduction. This will provide your readers a rough idea of what the report will be about.
Include a brief performance summary as well. Make sure you include important insights, such as the number of new followers or leads gained. To put it in another way, make sure you showcase the highlights of your campaign.
Once you’ve met your goals, don’t rest on your laurels. Whether you have exceeded or fallen behind your targets, be sure to set new goals and identify strategies that will help you achieve these goals.
Using progress is a great way to give a clearer picture of how you’ve grown over time, inside and out. However, different stakeholders will perceive progress in different ways. For example, some may be interested in seeing where you are now, and some in how you have progressed from a previous time frame.
A large part of what goes into a successful social media report is owning the data around the effectiveness of your content. Therefore, you need to ask the right questions.
For example, if you're writing a one-off report for an event, one question you may ask is, "How many free demo sign-ups did you get?". If you are doing a weekly report, "How many newsletter subscriptions did you receive per article, per week?"
Next, provide a quick overview of your most important social media result. Below are a few ways you can do it.
One thing you must keep in mind is that when we look at data visualization graphs, we should not only consider what data it is trying to display but also its aesthetics. Are the colors used in the chart appropriate for the type of data being forecasted? Not all graphs convey the same message with equal impact.
If you want to use a pie chart for data analysis, try to collect data where the totals add up to 100 percent. For example, it can help you gain a basic understanding of how your ad budget is being spent. Perhaps you’ve spent more on Google Ads or Facebook Ads than Twitter Ads.
Different audiences will be interested in different metrics. Below are the most common ones that you should start measuring.
Your social media report should be a reflection of your brand’s values. Every goal should be accompanied by a metric that can be used to evaluate whether or not your social strategy is on track. The following performance-based metrics will help you analyze your social media marketing efforts.
Content metrics: Tracking these content metrics allows you to evaluate and discover patterns in the type of content you share on social media.
Timing metrics: Tracking these timing metrics allows you to figure out the best time to publish your content and identify any scope of improvement.
Audience metrics: Tracking these audience metrics helps you figure out how much your target audience is interested in your content.
Listening metrics: Tracking these social media listening metrics helps you find out what people are saying about your brand and the sentiments involved.
Social media monitoring software can help:
Competitor metrics: Tracking these competitor metrics helps you figure out where your competitors excel in their social media strategies.
Engagement metrics: Tracking these engagement metrics gives you a good understanding of consumer engagement on different platforms.
Social media management tools can help you determine your engagement:
Social traffic metrics: Tracking these social traffic metrics helps you monitor how much traffic social channels are driving to your website.
There are digital analytics software that you can utilize for this.
Goal and summary metrics: Tracking these goal metrics helps you realize if you have met your social media goals.
Now that you know what data and metrics to include in your social media report, here are some platforms that can help you achieve your goals.
Facebook Insights
Instagram insights
Twitter Analytics
LinkedIn Analytics
Pinterest Analytics
Here are a few additional insights that may work wonders for your social media report.
Social referral traffic: Social referral traffic is usually considered 'good' traffic as it originates from a friend or from someone who finds your content interesting. It commonly occurs when people share your content on their personal social media accounts or simply because they like your content.
Conversions: Conversions are one of the few metrics that can be directly linked to return on investment. Your Facebook Ads Dashboard, for example, provides a plethora of potential indicators for reporting. All of them may be found under the ‘Customize Columns' option. No doubt, conversions should be the first thing you should track.

Depending on your audiences' preferences or your company’s requirements, you may create social media reports to build your brand on Instagram, Facebook, Twitter, LinkedIn, or Pinterest.
Tip: Download a social media report template if you're not sure where to begin.
Monitoring what's happening on your social media account is crucial so you can engage with the right audience and achieve more leads.
While it can be overwhelming to have several different social media sites to monitor every day, it's important not to let the volume scare you off. Marketers have more tools available to them than ever before. And that's an ideal start to get things going.
Planning to run social media advertising campaigns? Check out the top social media advertising software that makes it easy for you to buy and serve ads on social media platforms.
This article was originally published in 2021. It has been updated with new information.

Social media stands alone as one of the most powerful marketing mediums to promote and...
 by Devin Pickell

Are you a marketer looking for more ways to capture and analyze the many ways users interact...
by Devin Pickell

In today's hyper-connected world, public perception is everything.
 by John Croll