Tracking and interpreting customer data starts with understanding how to categorize it using ordinal data and seeking feedback. Ordinal data helps businesses rank variables like satisfaction or interest, uncover patterns through surveys, and align product decisions with real-time feedback.
Whether you're measuring sentiment, prioritizing features, or refining your go-to-market strategy, ordinal data bridges raw input with actionable insight. And with the right survey software or data analytics tools, you can collect, analyze, and apply this data at scale.
What is ordinal data?
Ordinal data is a form of categorical data where values are ranked in a specific order, but the spacing between them isn’t consistent. Businesses often use it to track customer satisfaction, preferences, or interest levels and make it key for interpreting consumer feedback and product guiding decisions.
For example, survey responses like “very dissatisfied” to “very satisfied”, or education levels like “high school, bachelor’s, master’s”, reflect increasing levels of something, but we can't measure the exact gap between them.
This structure makes ordinal data ideal for capturing human perception—how people feel, prefer, or prioritize—without needing exact measurements.
TL;DR: Why ordinal data matters for businesses
- What ordinal data is: Ordinal data ranks responses (e.g., poor to excellent) without measuring exact differences to help product marketers test features.
- How it's different from other data types: Unlike nominal data (no order) and interval/ratio data (equal intervals), ordinal data has a clear sequence but uneven spacing between values.
- Collection methods like surveys & Likert scales: Commonly gathered through tools like Likert scales, ranking questions, ANOVA, and satisfaction surveys, where responses are ordered.
- Business applications in marketing, HR, research: Used to measure customer sentiment, employee engagement, product preferences, and more, helping teams prioritize and segment effectively.
- Available statistical tests for ordinal data analysis: Best analyzed with non-parametric tests such as Mann-Whitney U, Kruskal-Wallis, Wilcoxon signed-rank, and Spearman’s rank correlation.
How does ordinal data compare to nominal, interval, and ratio data?
As opposite to ordinal data, nominal data is used to categorize without order (like user types or industries), while interval data measures variables like temperature or test scores with equal spacing but no true zero. Ratio data, on the other hand, includes both equal intervals and a meaningful zero, ideal for things like revenue or age.
The table below breaks down the differences between these four data types to help you choose the right one for your business use case.
| Feature |
Nominal (Labels) |
Ordinal (Ranks) |
Interval (Numeric, no true zero) |
Ratio (Numeric, with true zero) |
| Order of data |
❌ Not applicable |
✅ Present |
✅ Present |
✅ Present |
| Consistent spacing |
❌ Not applicable |
❌ Not applicable |
❌ Not applicable |
✅ Present |
| True zero point |
❌ Not applicable |
❌ Not applicable |
❌ Not applicable |
✅ Present |
| Statistical analysis |
Mode only |
Mode, median |
Median, standard deviation, correlation |
Full range of statistical ops |
| Business examples |
Type of employment, with outcomes like freelance, full-time, or hybrid work |
Survey responses from "strongly agree to strongly disagree", satisfaction levels, and income levels |
Temperature, standardized tests, measuring time intervals, difference between two readings |
Sales revenue, age, return on investment (ROI), analysis of financial information |
When should you use ordinal data in business?
Ordinal data should be used when analyzing customer satisfaction, agreeability, intent, or loyalty by cross-validating their economic status with their survey responses.
Below are some common, high-impact scenarios where ordinal data is the go-to format.
- Voice of customer (VOC) programs: Ordinal data captures sentiment shifts over time through ranked questions like “How satisfied are you with your onboarding experience?” These insights allow businesses to measure emotional progress between time periods and align product or service improvements with customer perception.
- A/B test experience feedback: Beyond raw click data, running A/B tests with responses like “Which version helped you complete your task more efficiently?” provides qualitative insight into user experience. This feedback helps evaluate perceived usefulness, refining product iterations based on what users feel works best.
- Brand sentiment monitoring: Ordinal scales (e.g., “Not familiar → Neutral → Like → Love”) help segment brand perception across customer types. These responses reveal emotional positioning, allowing marketers to distinguish brand loyalists from casual users and tailor campaigns accordingly.
- Product-market fit valuation: Questions like “How disappointed would you be if you could no longer use this product?” sort users into evangelists, casuals, or drop-offs. This ordinal approach identifies user loyalty tiers, guiding product roadmaps, messaging, and investment priorities.
In summary, ordinal data is mostly used when you care about human emotion, satisfaction, preference, and perception, and need a format that is structured and ranked but flexible enough to capture nuance.
Real world business use cases for ordinal data
Ordinal data powers key decisions across marketing, product, HR, and CX by helping teams rank sentiment, segment users, and track performance trends.
- Product feedback and roadmapping: Product teams use ordinal survey questions like “How useful is the new dashboard?” to gather ranked insights. These responses highlight what users value, flag pain points early, and shape roadmap priorities based on user sentiments.
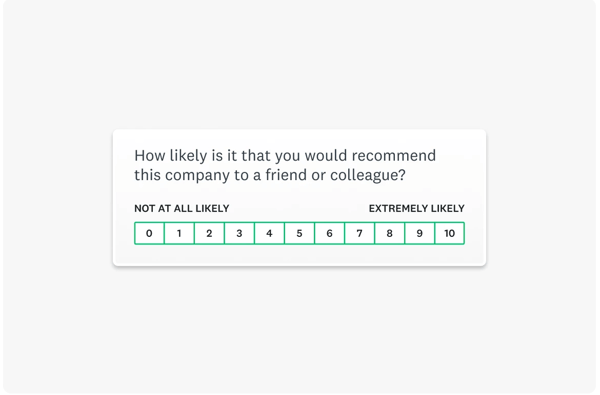
- Net promoter score (NPS) programs: NPS scores (0–10) are grouped into ordinal categories: detractors (0–6), passives (7–8), and promoters (9–10). Tracking shifts between these groups helps brands monitor loyalty, predict churn, and measure advocacy over time.
- Employee engagement and culture surveys: HR teams use ordinal scales to assess employee sentiment on topics like leadership, benefits, and workplace culture. These insights support decisions around retention, manager effectiveness, and inclusion initiatives.
- Customer support experience ratings: After support interactions, customers rate their experience on scales like “Very unsatisfied” to “Very satisfied.” When aggregated, these ratings reveal trends in agent performance and service quality.
- Brand perception and market research: Marketing teams collect ranked feedback on brand preference, ad effectiveness, and perceived product value. These ordinal insights inform positioning, messaging, and go-to-market plans.
How can you collect and analyze high-quality ordinal data?
While analyzing ordinal data is straightforward, the real value lies in how well you collect it. Flawed question design or poor execution can lead to misleading insights. Here are proven strategies to ensure your data is reliable and business-ready:
- Use balanced, neutral question framing: Avoid loaded or emotionally biased questions like “How amazing was your experience?” Instead, ask neutrally: “How would you rate your experience with our new product?” Neutral framing encourages honest, unbiased responses and protects data integrity.
- Limit the number of scale points: Too many options can confuse respondents. Use 4–7 scale points (ideally odd-numbered) to allow for a neutral middle. For example, a 5-point Likert scale from “Strongly Disagree” to “Strongly Agree” balances simplicity with nuance.
- Be consistent in scale direction: Keep scale direction uniform—for example, always placing “Strongly agree” on the right. Inconsistencies confuse respondents and may distort results. Consistency also improves the survey experience and trust in the data.
- Contextualize your questions: Add brief explanations for clarity. Instead of “Rate your satisfaction with integration,” ask “Rate your satisfaction with how easily our tool integrates with your current CRM.” Specificity ensures consistent interpretation and more accurate answers.
- Use reliable survey tools with logic branching: Choose trusted tools like Typeform, SurveyMonkey, or Qualtrics. These platforms support clean logic flows, conditional questions, and structured data capture. Always test the logic paths before going live to catch errors early.
- Pilot before launch: Run the survey with a small group—both internal and external—before full rollout. A pilot test helps spot confusing wording, broken logic, or scale misalignment. This step ensures your ordinal data is accurate, usable, and aligned with your business goals.
5 examples of ordinal data in statistics
Ordinal data occurs in different formats. Here are a few examples of ordinal data and how to synchronize it with your business strategy to improve your data management efforts.
1. Interest level
Whether you've already launched your product into the market or are introducing new features to your existing product, you’ll need to conduct market research to ask questions to gauge your target audience's interest.
Ordinal scales like "not interested" to "very interested" help marketers gauge interest levels during product testing, beta launches or feature validation surveys.
After a product demo, use a feedback tool to ask, "how interested are you to use
Market research involves analyzing both qualitative and quantitative data to understand customer needs, their buying patterns, and what motivates them to buy from you. These insights can help improve your marketing campaigns in the future.
For example, if you host conferences regularly, surveys can help you know how well you did and whether your attendees want to attend the conference again. Here's an example of interest-level data:
Source: SurveyMonkey
The questions you ask will reveal potential customers’ interest level in your product or service. Interest levels range from not interested, slightly interested, neutral, to very interested.
2. Education level
This type of ordinal data analysis provides insights into your target audience's proficiency level.
Education level may inquire whether your target audience has acquired different levels of formal education, such as high school, college, and graduate school. You may collect this data by assigning numbers to each level, such as 1 for no formal education, 2 for primary schooling, and so on, until 10 for a doctoral university degree.
Education-level data comes in handy when using analytics in your recruitment process to help you evaluate the job applications of potential candidates. Assigning values to educational milestones (e.g 1 = high school, 5 = doctorate) helps in recruitment analytics or audience segmentation.
Education level ordinal data can be used in applicant scoring models to assess training needs for customer facing teams.
Educational-level data can help you make powerful predictions about who to hire in the future to support company growth, where to focus your recruiting efforts, and find suitable candidates for specific positions.
If you run a sales team, assessing the education level of your team members enables you to know how to support their career development goals. This way, you can build a high-performing sales team and improve retention.
3. Socio-economic status
Understanding the socio-economic status of your target audience helps create and refine your customer segments based on their demographic and psychographic profiles.
Ordinal data set statistics like "low", "middle", and "high" income groupings give you insights into purchasing power and persona development. Studying the ordinal data of income level will help you understand the socio-economic status. An ideal use case is using it to segment B2C customers by income to tailor ad creatives and email campaigns.
You can then rely on these segments when running personalized marketing campaigns that meet their needs and wants. Ordinal data on socioeconomic status for a B2C target audience includes gender, location, household income, marital status, and age.
On the other hand, data for a B2B target audience includes gross annual revenue, stage of business growth, number of employees, market position, and type of industry.
4. Satisfaction level
The satisfaction level reflects how content your customers are with different brand interactions. For example, your customer onboarding process or how well you resolve different customer issues.
Frequently used with net promoter scores (NPS) or CSAT surveys, ordinal satisfaction data helps benchmark customer experience for companies.
A common use case can be creating a post support survey that could ask, "how satisfied were you with your recent service?" And the answers can range from extremely satisfied to extremely dissatisfied for customers.
Customer satisfaction may be expressed as extremely satisfied, satisfied, unsatisfied, or extremely dissatisfied. Satisfaction level data helps you gauge customer service and sales handling satisfaction to identify areas for improvement.
Here’s an example of satisfaction level data from a product-market fit survey that Buffer conducted:
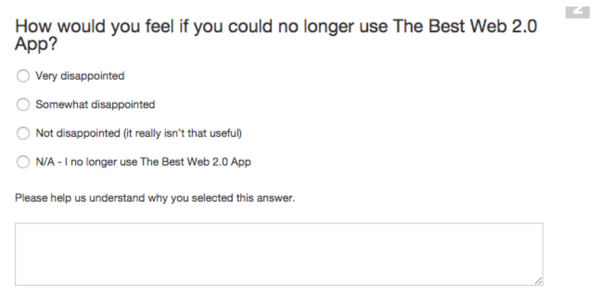
Source: Buffer
With this data, the company could tell how useful Buffer’s Power scheduler is to their customers, meaning that the product was the right fit for their users.
5. Comparative feedback
This involves asking questions that reveal the similarities or differences between two or more data points. Once you identify the similarities or differences, you can learn what characteristics are similar, which ones are different, and the degree to which they’re different or similar.
Ordinal data supports directional comparisons like, "compared to last year, how did our product meet your needs?" And the options can be range from significantly worse to significantly better. This enables you to analyse trends in product sentiment year over year for product roadmap planning.
For example, you may want to compare revenue performance from 2021 to 2022. Your comparison will yield significantly less, about the same, more, and significantly more for each year's revenue.
With this, you can gauge macroeconomic and industry trends and adjust your strategy to fit your budgeting process to control spending. You may even decide to take this further and compare industry trends so that you can create reports and write thought leadership content to drive brand awareness.
What statistical tests work with ordinal data?
You can conduct several tests on ordinal data to measure the difference between two or more groups. These tests include:
- The Kruskal-Wallis test: A non-parametric test used to compare the medians of three or more independent groups. It's ideal when the data is not normally distributed and group variances are unequal. It can also compare two dependent groups, such as before-and-after results from a website redesign.
- The Mann-Whitney U test: A non-parametric test used to compare the medians of two independent samples. It’s suitable for ordinal data like 1–5 rating scales and works well when there are no clearly defined groups or when working with small sample sizes.
- Wilcoxon rank-sum test: A non-parametric alternative to the paired t-test for comparing matched or paired samples. It's appropriate when the data isn't normally distributed and is often used to evaluate changes over time, such as customer satisfaction before and after a service update.
- Mood’s Median test: A non-parametric test for determining whether group medians are equal. It’s commonly used in opinion or sentiment analysis, such as measuring customer reactions to products or services. The test can help predict behavior based on mood, like purchase intent or brand loyalty.
What is descriptive statistics for ordinal data?
There are two ways to analyze ordinal data: inferential and descriptive statistics.
Descriptive statistics
Descriptive statistics for ordinal data help summarize the overall characteristics of a dataset and reveal underlying patterns.
Common descriptive measures include frequency distribution (how often each response occurs), measures of central tendency like the median and mode, and the range, which indicates the spread or variability within the data. These insights provide a foundational view before applying more advanced analysis.
Inferential statistics
Inferential statistics for ordinal data on the other hand, predict what may happen in the future based on the data you have.
You can use ordinal data to collect insights, create hypotheses, or even draw conclusions with the four tests described above.The Kruskal-Wallis, Mann Whitney U, and Wilcoxon signed-rank sum tests all analyze ordinal data. They're all nonparametric tests, meaning they don't rely on any assumptions about data distribution.
Descriptive analytics
Descriptive analytics collects, analyzes, and reports data about events that have already occurred. This differs from predictive analytics, which predicts future events based on historical data.
Descriptive analytics helps businesses identify patterns in the past to improve their future decision-making. In descriptive analytics, the goal is to find patterns n existing data, not predict the future. It aims to find cause and effect relationships between past events and use these relationships to predict future events.
How to represent ordinal data using graphs
Use graphs to simplify large or complex ordinal datasets. Choose your graph type based on purpose, data volume, and audience needs.
- Bar Graphs: They are best for comparing categories (e.g., satisfaction levels, weekdays). They are also easier to interpret than tables of numbers. You can combine them lines, scatter plots, histograms, or pie charts.
- Line Graphs: Line graphs are best for showing changes over time (e.g., monthly trends, rankings). They are also Ideal for tracking ordered progressions. They help show changes over time, like a gradual rise or decline.
Ordinal data: Frequently asked questions (FAQs)
What is ordinal data and how is it used?
Ordinal data is ranked categorical data where the order of values matters, but the differences between them aren't precisely measured. It's used to capture perceptions like satisfaction, interest, and agreement in surveys and feedback forms.
How do you collect ordinal data?
Ordinal data is typically collected through surveys, polls, or Likert scales that present a ranked range of responses (e.g., "Very satisfied" to "Very dissatisfied"). Tools like Google Forms, SurveyMonkey, and Typeform are commonly used.
What tests are used for ordinal data?
Non-parametric tests such as the Kruskal-Wallis H test, Mann-Whitney U test, Wilcoxon signed-rank test, and Mood’s Median test are used to analyze ordinal data when comparing groups or testing hypotheses.
What’s the difference between ordinal and nominal data?
Ordinal data has a meaningful order or ranking among values, while nominal data represents categories without any inherent order. For example, education level is ordinal; hair color is nominal.
How is ordinal data used in business decision making?
Businesses use ordinal data to assess customer satisfaction, employee engagement, product feedback, and brand sentiment. It helps identify patterns, prioritize improvements, and align strategies with audience preferences.
Way to customer satisfaction starts now
Familiarizing yourself with customer-oriented ordinal data sets a course for your product roadmap, new feature launches and customer satisfaction. Handling feedback surveys not only informs the customer that you as a brand are thinking of them but helps you deep dive into their preferences to fine tune your product efficiency.
Not only that, it segments your audience in a way where you can analyze the financial threshold before running a go to market campaign or a new advertisement to improve your chances of success. By breaking down ordinal data and studying the real numbers, you can paint a picture of the success or failure of your brand.
Learn how to segment, manage and visualize your data by checking out best data visualization tools in 2025 to delve into real-world consumption metrics and pave a brand roadmap.
This article was originally published in 2023 and has been updated with new information.