June 9, 2020
 by Mac Mischke / June 9, 2020

Remember this one rule when creating marketing reports: know your audience.
Who is going to see the report and what do they care about? As marketers, we love tracking every little metric we can get our busy hands on. However, most businesspeople only care about one metric: sales.
Appeal to your audience, and always focus on the bottom line. In this post, we’ll dive into the various data points and formats you can use to communicate the effectiveness of your marketing through reporting.
The best version of a marketing report shows how marketing efforts impact the company’s bottom line. The worst marketing reports show a smorgasbord of metrics that confuse anyone who is not a professional marketer. If you feel like your marketing reports fall on the wrong end of this spectrum, try changing the way you think about reports. Each report should be a translation tool that helps you turn marketing language into the language of sales and revenue.
Marketing reports can have a huge impact on the future of your marketing department or agency. When done well, a report can convince stakeholders that the marketing team deserves a bigger budget. A poorly written report might confuse stakeholders, leaving them unsure if your marketing efforts are delivering revenue for the company.
Below, we’ll go over some of the most common types of marketing reports. Read on to learn how each report can help you prove the value of your marketing efforts, effectively communicate to non-marketers, and use the reporting insights to improve marketing results.
Reports can be used to explain marketing results to stakeholders, but they also show marketers which campaigns deserve more spend and which should be shut down. In this piece, we’ll focus on lead-based marketing reports. Lead-based reports define marketing success in terms of how many leads are generated each day, week, month or quarter.
As a marketer, you know how all the different marketing metrics contribute to your department’s success. However, your CEO (in the case of an in-house marketer) or client (in the case of an agency) likely cares more about sales. The good news is, there is a metric that connects marketing to sales – that metric is leads.
For undisputable marketing reports, you must tie marketing to leads. Reports should be devoid of vanity metrics, and instead show how well each campaign delivered leads. Clients and CEOs may not understand how vanity metrics like views, clicks and impressions translate to revenue, but most businesspeople understand this: leads are fuel for sales.
Now that we’re cleared up the leads vs. sales issue, let’s talk about the various reports and when to use them.
Compared to monthly or quarterly reports, daily reports won’t be in front of clients and CEOs as often. Daily reports are more for you, the marketer. Use these reports to see how many leads came in today, view the marketing source for each lead, and mark leads as qualified (or quotable).
Daily reports capture a small sample size of data, and as a result, won’t cause as many changes as a full marketing campaign report. However, you can use daily reports to confirm that your campaigns are working and that your lead tracking tools are capturing the right information.
Weekly reports should be a compilation of the lead data from the past seven days. For hands-on clients and CEOs, weekly reports can provide some peace-of-mind that the marketing is running smoothly. With a larger sample size, you can gain more actionable insights from weekly reports than from daily reports.
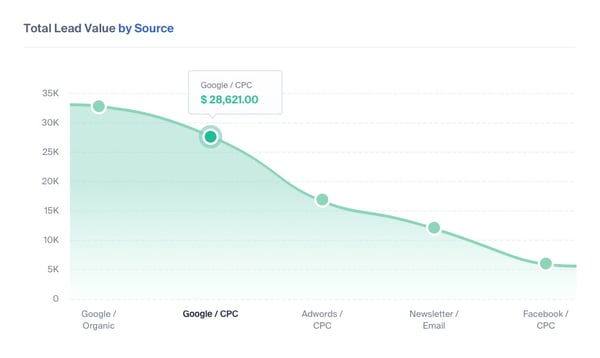
These reports should show the same type of data as daily reports; the number of qualified leads that came in and the marketing source that delivered each lead. You can further enhance these reports by adding potential sales value to the lead data. Adding a “Lead by Lead Value” graph shows clients or CEOs the potential revenue your campaigns are delivering. This type of marketing campaign report helps you figure out which campaigns are delivering a positive return on investment and which are losing money.

The monthly report is the most common type of marketing report. A month’s worth of data is a large sample size, so this report should give you actionable insights that you can use to stop ineffective campaigns and increase spend on campaigns that are delivering qualified leads.
The point of this report is to communicate marketing effectiveness to non-marketers. Focus on business metrics and avoid metrics that only make sense to marketers.
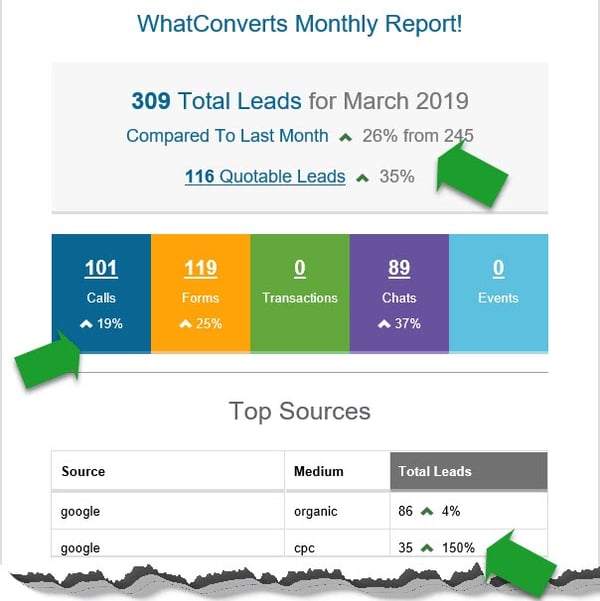
Here’s an example of a full lead-based monthly summary report.

The report starts with the number of leads that all marketing channels delivered this month. It also shows how this number changed compared to the previous month. Monthly reports should show progress or identify areas of regression. Next, you can show the number of qualified leads and how this number changed from the previous month.
Moving down the report, we see the conversion actions. Calls, form-fills, chats and transactions all count as conversions, and should be measured and tracked to the marketing source. Lead-based reports show how many leads came in via call, form, chat or transaction, then show which marketing sources delivered those leads and how well each source performed compared to the previous month.
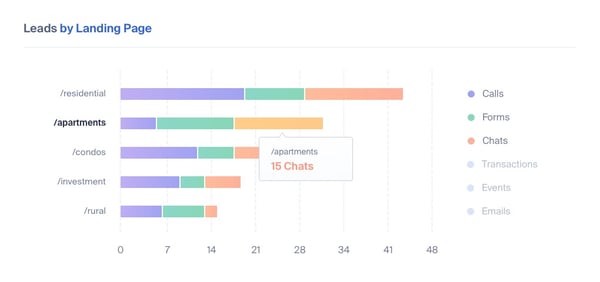
This particular monthly marketing report also features a Leads by Landing Page section; a simple chart that can help you explain SEO and website performance to your client or CEO.

While Google Analytics removed organic keyword data years ago in the name of privacy, a Leads by Landing Page report can help you get some of that data back. If you know which landing page a user came to, you guess which keyword they typed into Google to get there. The Leads by Landing Page chart can help you figure out which keywords the site is ranking for, and how potential customers are searching for the business online.
This kind of detailed information belongs in a monthly marketing report rather than a daily or weekly report. You need a large sample size upon which to base decisions about which keywords are worth spending more on in your next PPC ads or website rewrites. Determining keyword usage from landing page reports is an imperfect science, but the more data you have, the more accurate your assessment will be.
Lastly, and perhaps most importantly, we have quarterly reports. You can include most of the same information as you did in the monthly marketing report, but be sure to add the potential sales value attached to each lead.
Quarterly reports will have a major impact on your budget for the next quarter, so you need to show the value of the leads that your marketing department is delivering. If you can prove that one marketing campaign delivered a 200% return on investment, you might just see a 200% increase in your marketing budget. Lead value is the metrics that sets quarterly reports apart from daily, weekly or monthly reports.
Reporting meetings have to be engaging or the stakeholders won’t see how your marketing efforts are helping the company’s bottom line. Give your client or CEO more to chew on than simply charts and tables. Monthly and quarterly reports should feature strategy sections that explain the data, define your goals and measure the success of new marketing initiatives such as a lead generation campaign, a revamped email strategy, or a brand new website.
Revenue is the ultimate business metric, but tying marketing to leads is a more measure of success than tying marketing to sales. Marketers aren’t responsible for turning leads into sales. Salespeople are measured on their ability to turn leads into sales, but marketers should be judged on their ability to deliver qualified leads to the sales team.
This is a great time to explain to your client or CEO that you’re focusing on qualified leads, and clear up any discrepancies between how the marketing and sales departments track leads. Marketing departments can gain a huge advantage by disqualifying junk leads before they reach the sales team.
In many companies, marketing and sales blame each other when leads aren’t being converted into sales. The sales team blames the marketing team for delivering unqualified leads. The marketing team blames the sales team for failing to convert leads to sales.
By qualifying leads before they reach the sales team, marketers can make sure everyone is on the same page and create a better system of measuring marketing success. After all, your best campaigns aren’t the ones that drive the most leads; they’re the ones that drive the most qualified leads.
Before you put this section together, think about how your short-term and long-term marketing goals are related to the company’s bottom line. Do you want to grow the company’s LinkedIn following to 1000+ users? That’s a great goal, but if you can’t explain exactly how that will lead to increased revenue for the company, it shouldn’t be in your report.
Keep your goals focused on metrics related to leads, sales, and marketing ROI. Your client or CEO will appreciate the clarity with which you’re able to tie marketing to revenue without getting bogged down in vanity metrics.
Lead generation data: When reviewing the progress of your lead generation efforts, it’s helpful to show individual lead data to the client or CEO. When you can dig past the chart or table to actually show the lead’s contact info, place of business and conversion action, you can prove that there are real qualified leads behind the data.
It’s easy to show this type of lead generation data if you can integrate your marketing tracking tools with your CRM. That way, you’ll be able to keep the marketing data attached to leads as they move through the CRM towards conversion to customers.
Email marketing and newsletter data: As a marketer, you’re concerned about the open-rate and click-through-rate for your email marketing and newsletters. However, your CEO or client is not interested in those kinds of marketing metrics.
Instead of showing how many people opened, clicked on, or unsubscribed from your email, show how many leads came from your email marketing. Use UTM codes in your email to track leads to conversion, and display this lead data in your report.
SEO and site traffic data: Two charts that can help you communicate how well your website is converting visitors to leads; Leads by Landing Page; and Leads by Lead Page. The first shows which page people landed on before performing a conversion action (call, form-fill, chat or transaction). The lead page report shows which page people were on when they called, filled out a form, initiated a chat or completed a transaction.

Landing pages and lead pages are the most important pages on your site, and this data shows how well they're working. It might be tempting to include other metrics like total views, bounce-rate, and time-on-page, but remember that those metrics don’t directly translate to sales. Leads do, and that’s the kind of metric your client or CEO wants to see.
One reason marketers love social media so much is because there are so many metrics to go along with it: likes, impressions, interactions, followers, and more. It’s vital to remember that none of these metrics are directly tied to sales. Leads, however, are.
It’s okay to track social media metrics during your day to day role as marketer; they’re indicators of success. When it comes time to show your client or CEO how well your marketing has been working, however, you need to clearly show how well your marketing is driving leads.
Be sure to use UTMs in your social media posts so you can see if anyone clicked on your social post, came to your website, and converted via call, form, chat or transaction. The same rules apply to paid ads, although you can add lead value to these reports to show the ROI of your social media advertising efforts.
Use this section to display the most notable numbers from your reports. Don’t be afraid to be big, bold and proud. Show off the marketing campaign that delivered the most qualified leads. Highlight the marketing source that attracted high value leads while keeping spend low. This section is your chance to prove the impact your marketing efforts had on the company’s bottom line.
If you’ve recently implemented lead-based reporting, you can use this space to explain how this new reporting style has improved sales conversion numbers and created more cohesion among marketing and sales.
In your conclusion, explain how your approach to reporting will help the company spend marketing dollars more efficiently. Use examples to show how you can use data to be a better judge of marketing success. Here’s one example:
Imagine you’re running two PPC campaigns. Version A delivers 50 leads and Version B delivers 100 leads. However, if you have insights into the lead details, you can see that 75 of the leads from Version B aren’t qualified. If you weren’t qualifying your leads, you’d think Version B was more successful. Since you are qualifying leads, you know that Version A is actually the PPC campaign that deserves more spend.
Leads might not be qualified for a number of reasons, including budget issues, or they’re in the wrong geographic location, or they’re spammers or solicitors.
What we’ve hoped to establish in this article is that marketing reports should be viewed as translation tools. In order to use reports to translate your marketing metrics to clients and CEOs, you have to get outside your marketing bubble and get inside the businessperson’s bubble.
While reports filled with non-lead metrics can be useful to your marketing team, the reports that you use in meetings with key stakeholders should be focused on leads and lead value.
With the right tracking tools, you can track every new lead back to the marketing source and prove the exact ROI of every campaign. Do this enough, and you’ll see your marketing budget grow.
Mac Mischke is a content marketer at WhatConverts where he helps businesses find out what marketing works
Scroll through a few marketing blogs, and you’d think the marketing tools have already taken...
 by Priyal Dangi
The MarTech industry is fast-growing, fast-evolving, and a bit overwhelming. A new tool crops...
 by Soundarya Jayaraman
If you’re just starting out as a real estate agent, it can feel daunting to envision building...
 by Izabelle Hundrev
Scroll through a few marketing blogs, and you’d think the marketing tools have already taken...
 by Priyal Dangi
The MarTech industry is fast-growing, fast-evolving, and a bit overwhelming. A new tool crops...
 by Soundarya Jayaraman


