April 24, 2019
 by Alexa Drake / April 24, 2019

Math can be hard, but analytics doesn’t have to be.
If you’re using Instagram to market and advertise your business, you want to be sure you’re serving ads and content to the right audience. Did you know that when you create an Instagram business profile, you get a free analytics tool? Maybe you already knew that and keep track of your follower growth, but have you really dived into your analytics to understand who your audience is?
Instagram Analytics is a free analytics tool within each Instagram business page that tracks metrics such as profile visits, website clicks, reach, and impressions. The tool also collects data that can tell you when your audience is most active, where they live, their age, and their gender.
Continuously referencing your Instagram Analytics can help you understand how to engage with your followers and will inform you of what types of content they enjoy.
In this article, we’ll walk through which metrics are most important to track for your business and how to access that data. We’ll talk about why you should start paying attention to your Instagram Analytics and how to utilize them to enhance your Instagram marketing strategy.
How to view Instagram Analytics
Instagram Insights
Instagram Story analytics
Analytics tools
Instagram has over 1 billion users, with 25 million of those accounts being business profiles. That’s a lot of people who are trying to advertise to the public, so naturally, there’s a lot of competition.
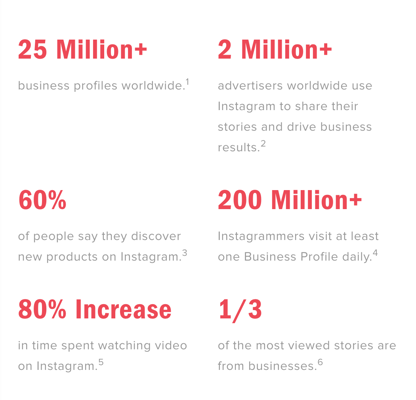
Image courtesy of Instagram
Out of 1 billion users, roughly 200 million of them visit at least one business profile on a daily basis. There’s endless opportunity to expand your reach when you use Instagram for business. Implementing Instagram into your marketing campaign is a no-brainer.
But why should you pay close attention to your analytics? Sure, you may be seeing engagement on your profile, but if you don’t know who’s interacting with you, how your posts are performing over time, and how they affect your ROI, posting on Instagram is just that. Posting.
By referencing your Instagram Analytics, you’ll be able to target the right audience, post the best content, discover the best time to post on Instagram, drive traffic to your website, convert users from followers to buyers, and build your business’ online presence. This just scrapes the surface of what Instagram Analytics can help you achieve. So take a closer look.
To access your analytics, open Instagram and navigate to your profile page.
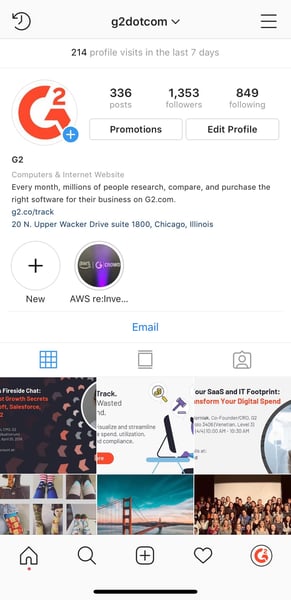
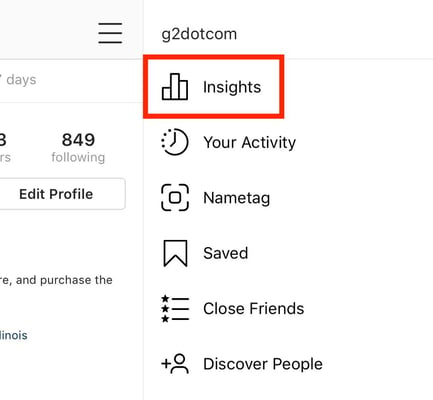
At the top of your profile, you’ll see a bar that tells you how many profile visits your Instagram account has seen in the last seven days. You’ll need to click on that to access Instagram Insights. (Alternatively, you can also swipe left and click on the Insights tab.
Download The Beginner's Guide to Instagram and get started 🚀
Instagram Insights is Instagram’s free analytics tool. Once you’ve accessed Insights, you’ll see three data tabs including Content, Activity, and Audience.
In the Content tab, you’ll see the Feed Posts you’ve shared, the Stories you’ve posted, and the Promotions you’ve carried out.
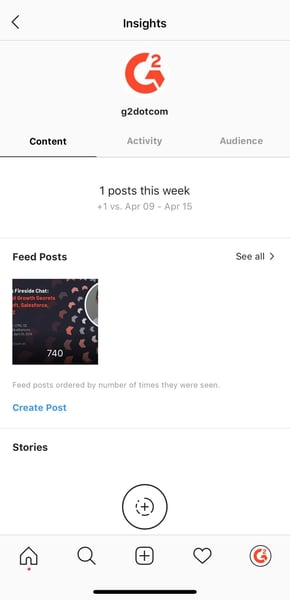
By clicking on See all on the Feed Posts tab, you’ll be taken to a page where you can see your posts from the past year sorted by total engagement (likes and comments combined). Having your posts laid out like this can help you understand what content is standing out to your audience.
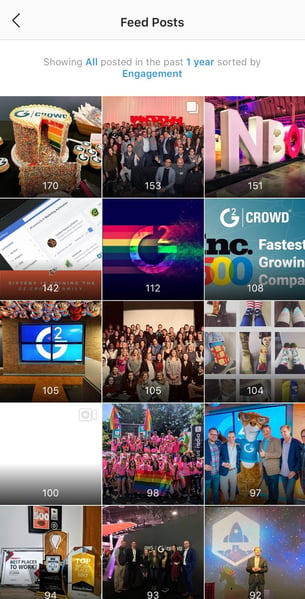
You can focus in on one type of content (like photos, videos, or carousel posts) and filter the engagement by comments, emails, impressions, profile visits, etc. You can also apply a time filter so you can see engagement from the past week to the past two years.
Playing around and observing your engagement in this way can inform you of which posts encourage shares, website clicks, emails, likes, follows, etc. You can determine if videos work for your business, the types of content people comment on or share, and which posts drive the most traffic to your website.
You can also view the Impressions your posts receive (the total number of times all of your posts have been seen on Instagram) as well as your Reach (the number of unique accounts that have seen any of your posts).
Alone, the Content tab can provide you with a ton of useful information that you can use and reference when posting in the future.
The next tab over is the Activity tab.
Under Interactions, you can see all the actions taken on your account within the last week.
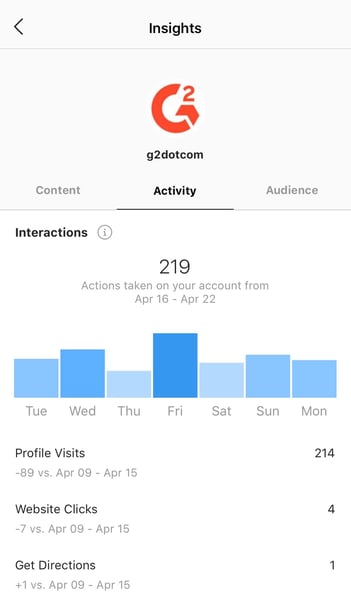
By looking at the graph, Instagram breaks down which day of the week sees the most interaction and just how many interactions were taken. These could be profile visits, website clicks, getting directions, etc. Each of these are listed below and inform you of the difference in interaction versus the previous week.
Further down the page, you’ll see the Discovery tab.
This section measures how many people saw your content and where they found it.
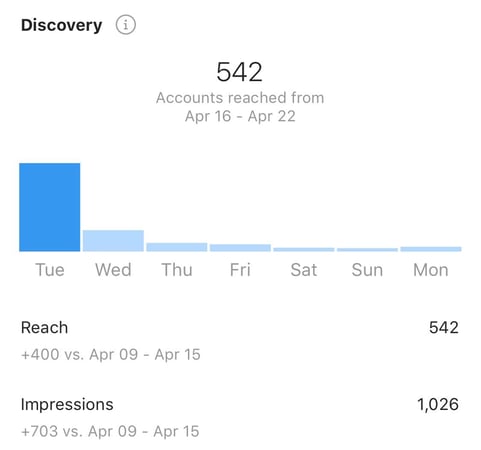
The Discovery tab is broken down into Reach and Impressions. Reach informs you of the number of unique accounts that have seen your posts while Impressions is the total number of times all of your posts have been seen.
For our example, we can see that Tuesday was the best day for discovery. Referencing this data is helpful when tracking your content’s progress. You can take note of this data each month to make sure your content is reaching more and more people as time passes.
The last tab within Instagram Insights is the Audience tab. Here you’ll find information regarding the demographic of your audience.
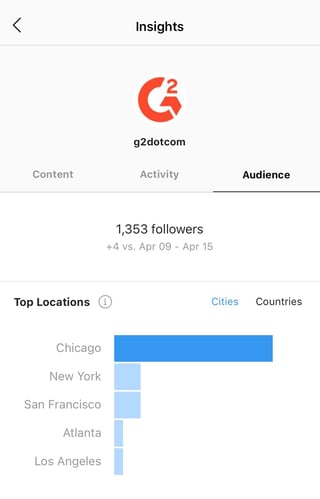
At the top, Instagram provides you with data on where your audience currently lives. You can toggle between Cities and Countries and discover where you should be focusing your marketing efforts.
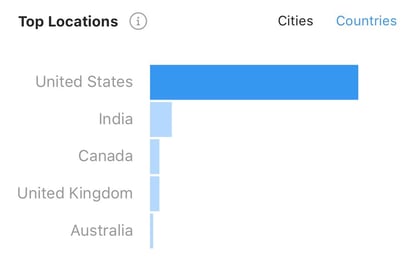
This information is important when your marketing team is planning a campaign. If you know that the majority of your audience lives in Chicago, targeting your ads to people living in Naples, Florida would result in money spent carelessly. On a broader scale, if you know roughly half of your audience lives in the United States while the other half lives in the United Kingdom, you wouldn’t waste your time serving ads to people in Australia.
Scrolling down, you’ll find the Age Range and Gender tabs.
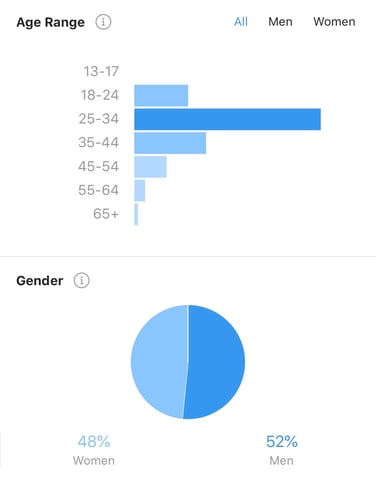
This data is pretty self-explanatory. Just like location, understanding your audience’s age and gender can help you target them more accurately. If the majority of your audience is between the ages of 25 - 44, using super “topical” and “in” slang wouldn’t be productive. Most of these people will have careers, so in this case, a more professional tone would work better.
The last section is Followers. This data details the average times your followers use Instagram.
You can view this data in two ways, by hour or by day.
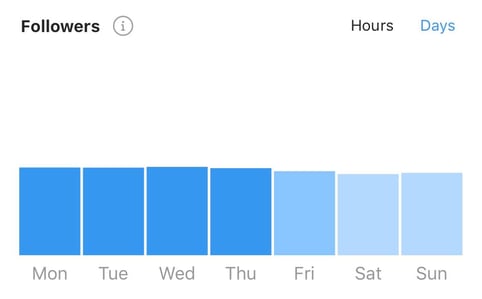
Broken down by days, you’ll know what day of the week is best to post to Instagram. Additionally, if you switch to hours, you can be sure that you’re posting during a time frame when your audience is online.
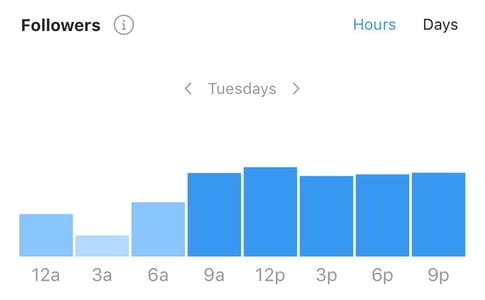
The more you get to know your audience, the better you can be sure that they’ll engage with and enjoy your content.
Maybe you want to focus in on a singular post you recently shared with your followers. This can be done by clicking on View Insights.

Once clicked, you can see the number of likes, comments, saves, and how many times someone sent the post to another Instagram user.
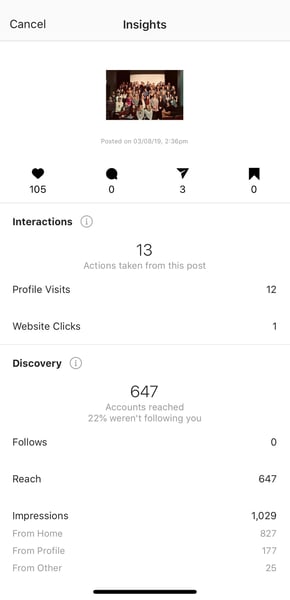
These analytics tell you how many times someone visited your profile after seeing the post, how many website clicks the post encouraged, followers gained, number of accounts reached, and impressions. You’re presented with more information when viewing a single post’s analytics, so use it to your advantage.
If you’re not sharing content with Instagram Stories, you’re missing out on another opportunity to reach a wider audience. Did you know that you can collect data from your Stories? After your Story has been up for a while, you can view:
Reach: The total number of unique users that viewed your Story.
Impressions: The total number of times your Story was viewed.
Replies: The total number of replies to your photo or video Story.
Shares: The total number of times your Story was shared with other users.
Exits: The number of times users exited your Story while they viewed it.
Although this information is less detailed, you’ll still be able to note your total Story engagement month-over-month to make sure you’re reaching more people as time passes.
Analytics can be a lot to keep track of, but the good news is that analytics tools exist to make the process easier. Analytics software can assist you in tracking and evaluating your Instagram Analytics quicker and more efficiently. It’s recommended to do a bit of research before selecting which analytics software you’ll use, but here are some options available to you:
Hootsuite (4.1 ★ based on 2,700+ customer reviews on G2) Hootsuite is designed for organizations to execute social media strategies across multiple social media networks, including Facebook, Instagram, Twitter, Linkedin, Pinterest, and YouTube. The tool has a 30-day free trial version of their software you can use to connect three social media accounts and monitor analytics. Hootsuite provides a comprehensive analytics tool that captures social data and provides executives with actionable insights for business decisions. Their “Professional Plan” is $29/month and allows you to connect 10 social accounts.
Zoho (4.5 ★ based on 1,600+ customer reviews on G2) Zoho Social is a complete social media management platform for businesses & agencies. It helps you schedule posts, monitor mentions, create custom dashboards, and more. It includes a powerful set of features that helps you track relevant social conversations and respond to what matters. Advanced reporting features help you analyze performance using intuitive graphs, and create unlimited custom reports. Zoho offers a free version that allows you to connect one team member, one brand, and six social channels. Their standard plan is $15/month and allows you to have two team members, serves you basic stat reports, scheduling, along with a variety of other features.
Sprout (4.3 ★ based on 850+ customer reviews on G2) Sprout focuses on three main functions: publishing, engaging, and reporting. Sprout provides solutions for social marketing, social management, customer service, and team collaboration. It is a social media management software that acts as a hub for your social publishing, analytics, and engagement across all of your social profiles. Their ample reporting capabilities provide insightful analytics and enable you to quantify your social communications. A standard plan is $99/month and allows you to connect five social profiles.
Check out Sprout's comprehensive roundup of Instagram analytics tools to master your performance on the social platform.
If you'd like to read some real customer reviews first, head over to our social media analytics software category page to compare options.
It doesn’t matter if you’re new to the world of analytics or if you’ve been in the game for a while, as marketers, we can all brush up on how to understand and use our analytics to our advantage. Track your progress and discover what works for your business. It can be daunting, but it doesn’t have to be hard.
Check out our social media marketing hub to learn even more about social analytics.
Alexa is a former content associate at G2. Born and raised in Chicago, she went to Columbia College Chicago and entered the world of all things event marketing and social media. In her free time, she likes being outside with her dog, creating playlists, and dabbling in Illustrator. (she/her/hers)
Curating a marketing strategy isn’t an easy feat, but it’s certainly not impossible.
 by Alexa Drake
Organization is at the core of a strong social media strategy.
 by Alexa Drake
Curating a marketing strategy isn’t an easy feat, but it’s certainly not impossible.
 by Alexa Drake


