
Understanding your audience is a key factor in running successful marketing campaigns.
We already know that social media is one of the most efficient ways to reach an audience on a daily basis. But posting to any social media platform without knowing which content resonates best with them is a missed opportunity.
If you’re a social media marketer, knowing how to read your analytics is important in continuing to grow your online presence. Facebook has a free analytics tool built into every Facebook business page that makes it easy to understand who your audience is, their social habits, and their interests. Using this information to your advantage will help you post content they will appreciate and engage with.
Facebook Analytics is a built-in tool that tracks and measures your social content’s performance over time. The tool gives you insight into your content and how many likes, comments, page views, and post impressions you’re getting.
It doesn’t matter if you’re just starting out or a seasoned marketing professional, utilizing Facebook Analytics is a smart move. You’ll learn how to engage your audience, and in turn, build your business’ presence online.
In this article, we’ll go over why you should pay attention to your analytics, the metrics you should be tracking, and how to read them.
Your 28-day summary
Growth Metrics
Engagement Metrics
Page Metrics
People Metrics
To access your analytics, you’ll need a Facebook business page (we hope you’ve had one for a while, the longer you’ve been using your page, the more information will be in your analytics). It’s time to jump into Facebook Analytics. Your homepage will look something like this.
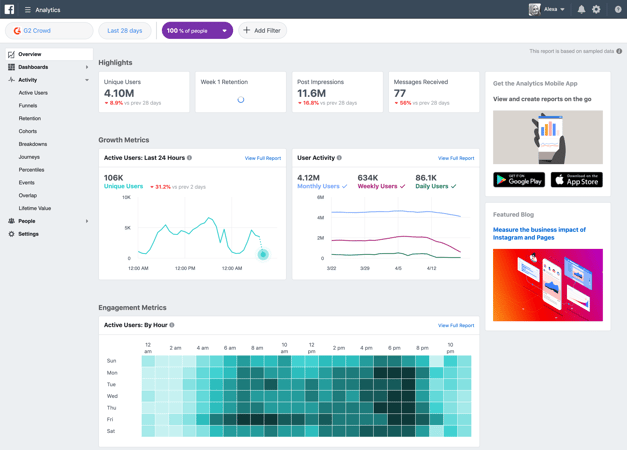
Across the top of the homepage, Facebook autogenerates a 28-day summary that includes a snapshot of the past month and how much engagement your page has seen. The summary includes: Unique Users, Week 1 Retention, Post Impressions, and Messages Received. You’ll also be able to see the difference in engagement from the previous month which can be helpful to track your page’s progress.
Your homepage may be overwhelming at first, especially if you’re looking at your analytics for the first time. Let’s break down each section so you get an idea of which metrics will be useful for your business to track.
To begin, let’s click the Unique Users tab. In this section, you’ll see a graph that tracks the number of unique visitors that have clicked on your page. Unique users can be described as the number of individual people who are clicking on your page or using your product/service.
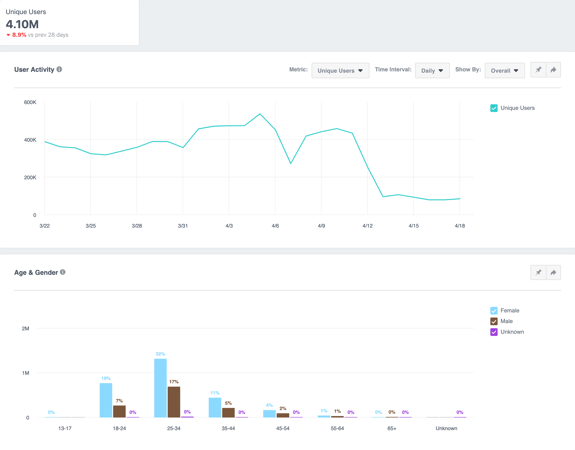
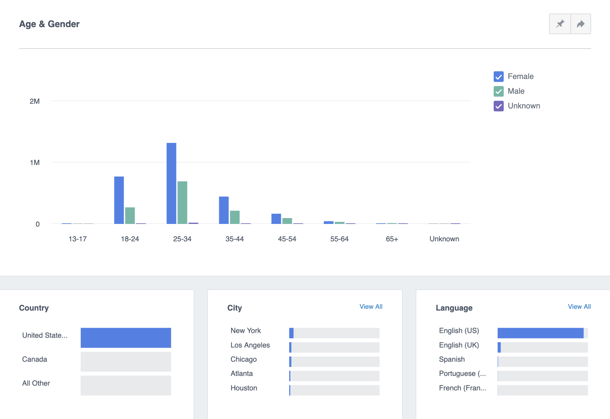
Below this graph, you can see the age and gender of your audience which can be helpful when planning your campaigns. If your audience skews older, using “trendy slang” might not be the best way to engage them.
You can also change the metric you’re tracking with the settings at the top.
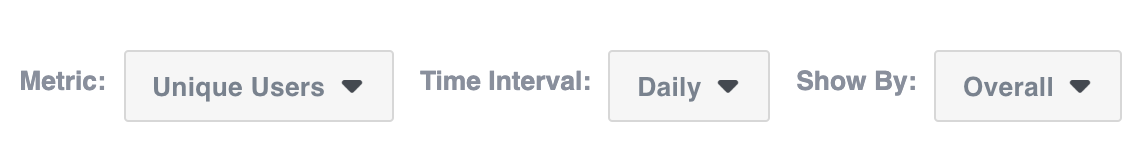
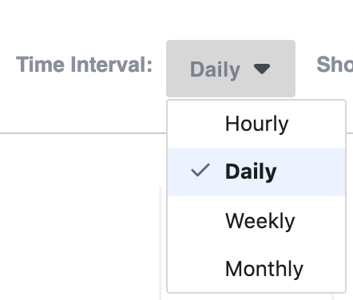
By changing the metric, you can see the user activity by month, week, and day.
If you’re looking to get specific, you can change the time interval and view your user’s activity by the hour.
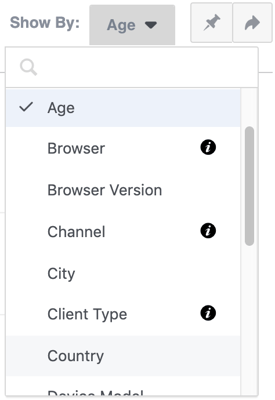
The last metric within User Activity can be viewed by changing demographic categories. You have a category list that ranges from city to device model to language. Every time you select a different category, a different graph will appear showing you the metrics for said category.
Just like Facebook Audience Insights, a subsection of Analytics, you can really get specific with your demographic information. The better you analyze your audience, the better you can advertise to them.
Back on the analytics homepage, click Post Impressions at the top. The first thing you’ll see is the number of post impressions your page has been getting overtime (split into paid, organic, and viral advertising).
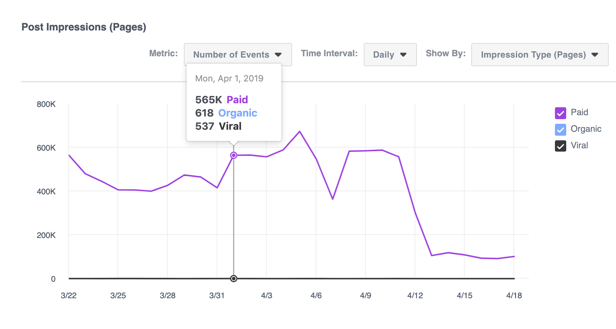
By toggling paid, organic, or viral on and off, you can see the reach your page is getting for each category. Just like Unique Users, you can change the metrics at the top of the page to analyze the information even further and view the Age & Gender data at the bottom of the screen. (This won’t change for any of the sections we will discuss).
Below your 28-day summary is the Growth Metrics. This section consists of two analytics reports: the Active Users report and the User Activity report.
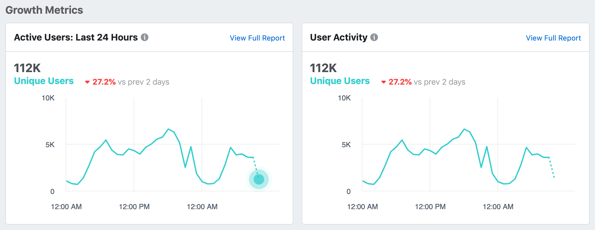
We’ll focus on the Active Users section first. In this section, Facebook tracks how active your users have been the last 24 hours. To dive deeper, click View Full Report.
This page will look similar to the Unique Users page. The only difference is that this graph tracks the activity of these users over the last 24 hours. (You can also change the tracked time using the metrics menus at the top of the screen).
![]()
By looking over this graph, you can determine when your audience is online and engaging with your content. From this data, you can easily determine the best time to post on Facebook for your business. Try out a few different posting times and see which gets the most activity.
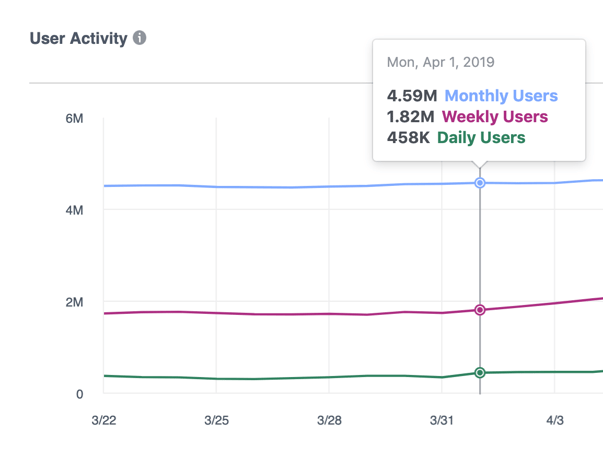
The second section in Growth Metrics is User Activity. The default view of this graph will show the number of active users (in the past two days) who are currently using your product for any given day, week, or month.
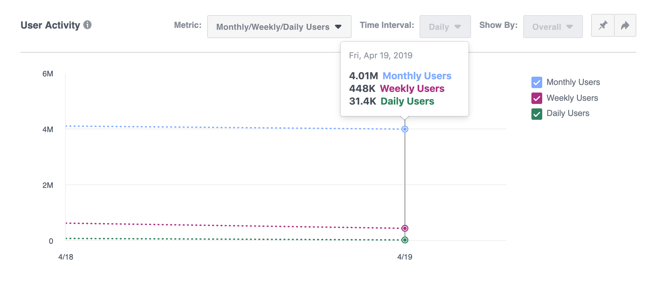
This data can be used to track your Facebook page’s growth and progress.
The next section on the analytics homepage is Engagement Metrics. Just like the Active Users section, Facebook lays out a tiled graph that details when your audience interacted with your business page.
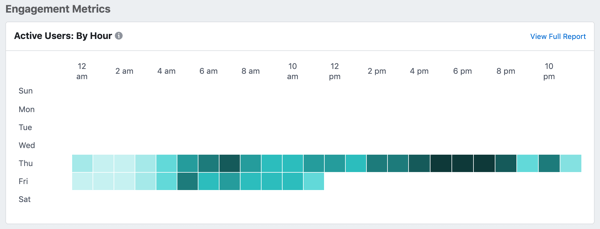
For this example, we can see that G2 has active users on Thursdays and Fridays, the most active hours being Thursday from 3 pm to 8 pm. Just from looking at this graph, you’d be able to decide when to post your most important content. If your audience is most active on a specific day or during a specific hour, take note of the difference in engagement and post at that time.
Page Metrics consists of four sections: Post Reactions, Post Shares, Post Comments, and Messages Sent. You’ll be able to see how your posts have been resonating with your audience. Have they commented on them? Shared them with their friends? Reacted to them on their timeline?
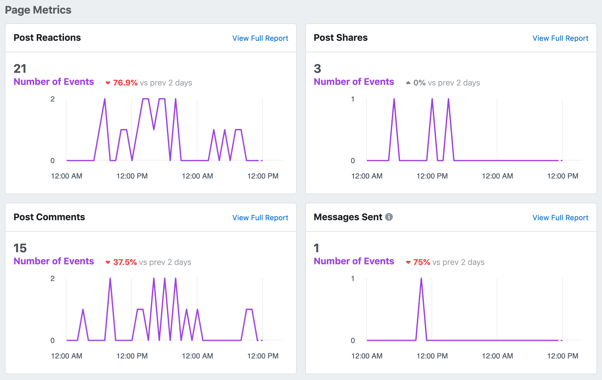
This is the place you’ll want to go when you want to assess if your content is working well (AKA, if you’re seeing your engagement numbers continuously rising). If not, try something new and keep an eye on these metrics. It’s all about troubleshooting and adjusting when it comes to analytics.
The last section of your analytics homepage is People Metrics. In this section, you’ll see data regarding gender, age, and location. Think of this section like a demographic snapshot.
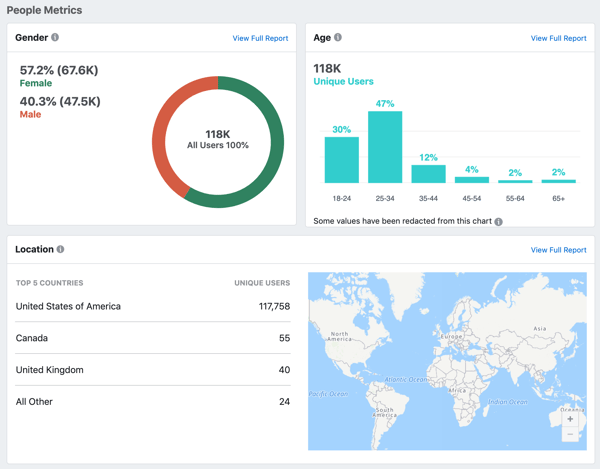
This is where you get to know your audience. Knowing their age can help you post and promote content that will be the most relevant to them, and knowing where they live can help you target specific locations. (Plus you can save money by not advertising in locations where your audience isn’t).
When thinking about how to advertise on Facebook, looking over these demographic analytics can make a difference. If you’re spending money advertising to people in London when your audience is primarily in the US and Canada, you can tweak your campaign and spend that money elsewhere.
If you click on View Full Report, Facebook details the analytics further. You’ll be able to see the cities your audience lives in and what language they speak.
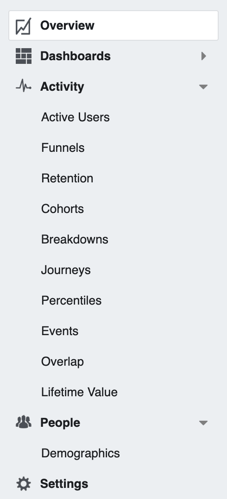
There are a variety of other analytics tools you can use to the left-hand side of the analytics homepage screen. Try each one out as you continue using Facebook to advertise.
The benefit of looking over your analytics is learning how to use that data to inform your next campaign. For example, if you notice that your business sees the highest number of conversions after running a poll, it’s clear that you can assume that more polls would be beneficial to get more of them to convert to buyers instead of just followers.
You can dive deep into your analytics. The more you study it, the better you can understand who your audience is, where they live, what content they like, where your ads should be placed, and which strategy you should implement when communicating with them.
Check out our social media marketing hub to learn even more about social analytics.

Once you have a basic understanding of the data Facebook Analytics provides you, remember to continuously check your analytics. Like everything on the internet, Facebook will continue to change, so referencing your progress every month can keep you on track to see your business grow.
Take the time to explore your Facebook Analytics. Knowing how to navigate the tool is essential to communicating with your audience and maximizing engagement.
Want to dive deeper? Learn everything you need to know about Facebook marketing.


This ultimate guide has everything you need to know about customer acquisition. In simple...
 by Tytus Golas
We might have come across machine learning techniques like k-means clustering, random forest,...
 by Amal Joby
Learning to use generative AI tools can prove daunting for the uninitiated. Between the...
 by Christophilos Theodosis