October 28, 2019
 by Nikola Kožuljević / October 28, 2019

A company-wide understanding of user/customer engagement should be a standardized, cross-departmental practice.
A company-wide understanding of user/customer engagement should be a standardized, cross-departmental practice. If you’re still not there, you’re lagging behind. This article will help you discover why it’s not ideal for you and your business.
A majority of points here may not apply to all businesses out there. But as long as your business has any touchpoints with the user/audience/customer over any type of digital content or medium, we assure you’ll learn something new.
Peter Drucker’s “what gets measured, gets managed” proclamation points to an obvious truth digestible in various forms. What you measure is what you care about. If you don’t measure, you can’t improve. What you don’t measure you obviously don’t care or are not interested in understanding.
Thus, companies are what companies measure. Those that don’t measure are simply unfocused and handicapped for their long-term survival. And that is especially valid in today’s world of data and data-driven decision making.
A study finds that:
"Organizations that demonstrate higher levels of analytical maturity saw a marked advantage in their customer relationships. The most analytically mature organizations are twice as likely to report strong customer engagement as the least analytically mature organizations.”
Similarly, Michael Scharge notes that:
"People, process, and technology are radically reorganized around metrics. Data and analytic priorities, as well as decision-making authority, are redefined and determined by smarter KPIs. Your KPIs are your strategy; your strategy is your KPIs. For top-tier transformers, KPIs explicitly shape the strategic leadership dialogue and debate.”
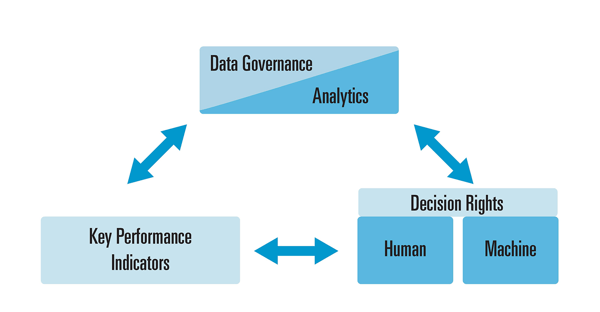
In that same article, Scharge notes that evolution is happening. Both on KPIs, their types, strategies and decision making. They are all part of a so called KPI Virtuous Cycle - processes linking KPIs, data, and decision-making reinforce key interdependencies and enable the strategic execution that digital transformation demands.

Scharge argues that “people, process, and technology are radically reorganized around metrics. Data and analytic priorities, as well as decision-making authority, are redefined and determined by smarter KPIs.”
Of course, there are various smarter KPIs businesses should track and measure in a smarter, more strategic way. Churn, gross and net churn, customer lifetime value (CLV), and annual revenues per account are just some of those worth noting.
Though the most important ones, and the most reasonable to start with, are actually tied to user engagement and behavior.
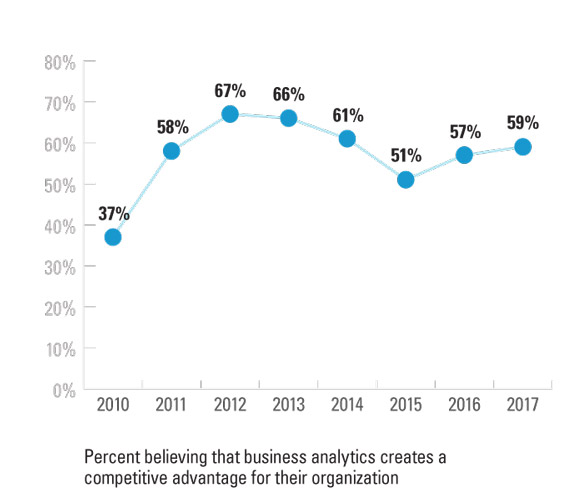
Users, clients, and prospects are critical of every business – and measuring user engagement is important. There’s a significant increase in the number of organizations that are using analytics to gain a competitive advantage and innovate – a key component of this shift is more effective use of analytics to improve customer engagement.

Courtesy of MIT EDU
Blake Morgan positions user engagement within the entire customer experience strategy crucial for business success. Morgan notes user engagement as a “metric tracks how engaged customers are by measuring things like how often they communicate with the brand, how long they spend on the website and how many clicks they make.”
Customer engagement is related to overall profitability, as engaged users are more likely to buy, become repeat customers, and share the product/service with other people. SEJ mentions 10 most common and most important KPIs to measure: pageviews, time on page, average session duration, bounce rate, top exit pages, pages per session, page/scroll depth, unique visitors, new vs. returning visitors, conversion rate & abandonment rate.
Partial or superficial usage of measuring user engagement just because it’s trendy and presumed will lead you nowhere.
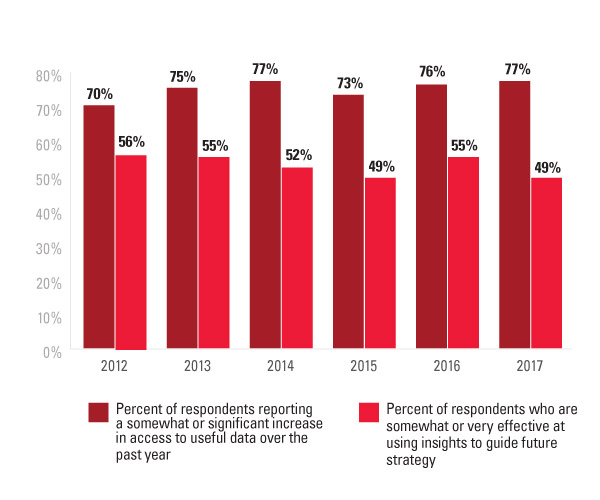
Many companies are still struggling to extract actionable insights from this mushrooming storehouse. The gap between more access to useful data and the ability to develop practicable insights has doubled, from 14% in 2012 to 28% in 2017. Only 49% of respondents in 2017 reported being able to use data to guide future strategy, compared with 55% in 2016.

Courtesy of MIT EDU
Start by asking the right questions and set some hypotheses. Onward, get knowledgeable of the basic measurements and gather the data from multiple data sources. Lastly measure, analyze and answer the question you’ve set to start with.
The foundation of understanding your user engagement is in a more conceptual dimension rather in the technical bits, measuring, or acquiring the data. The biggest hurdles in measuring and understanding your user engagement is in the absence of strategic necessity for it. If there’s no need for measurement or a company-wide direction then doing everything else is futile.
Additionally, asking the right questions, being hungry for understanding and knowing what you can and cannot do is the tough stuff. The other bits, measuring, data collection, reporting – are rather simple. Especially taking into consideration the array of tools, solutions, resources and professionals on this topic. You can start with a simple tool and master the ins and outs of it.
If you’re not sure which tool to pick, start your research at G2 and then compare the features, prices and the compatibility with your use case and strategic need.
For all digital analytics solutions start at the Digital Analytics category:
Digital analytics software tracks website visitors and measures web traffic. Marketers, web developers, and analysts use digital analytics suites to report on the effectiveness and popularity of web experiences and to determine how visitors are finding and interacting with their sites. This analysis provides businesses insights into customer behavior when encountering their brands online and allows reporting on online conversion, demographic, and content-interaction metrics.
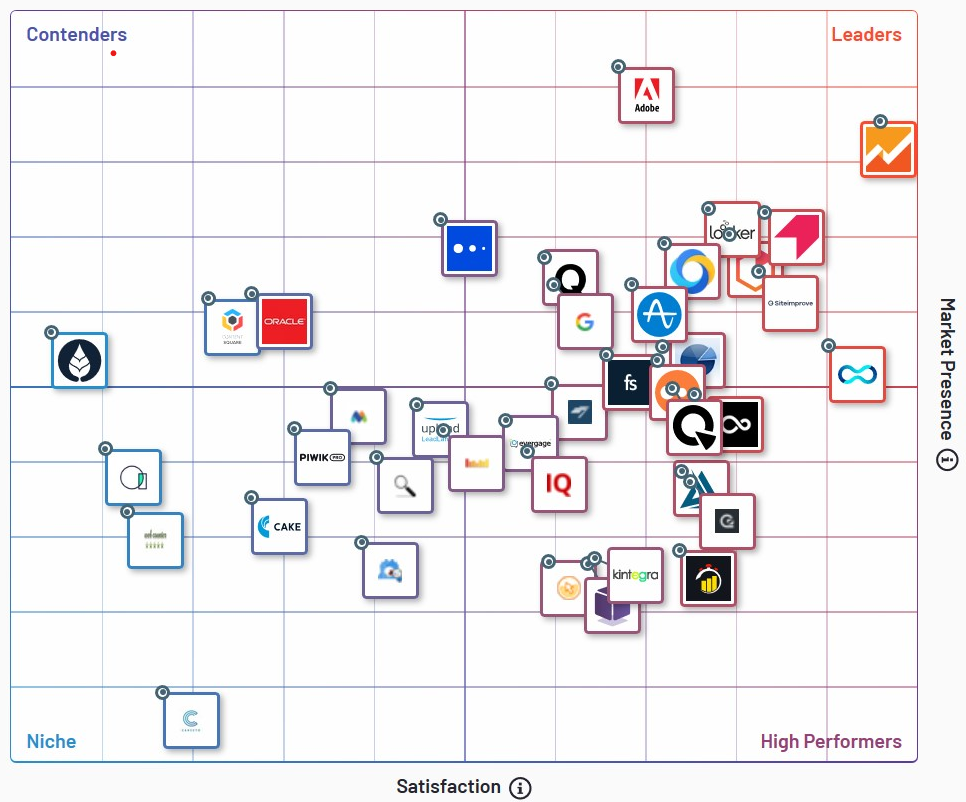
Here’s the G2 Digital Analytics software market overview:

As you see from the grid there are many tools out there. And indeed, many of them have a specific use case. But what really makes them useful is thorough and proper usage. From basic session tracking, to event, funnels tracking, session replay, heatmaps – there are various pools of data to gather data from.
And that multiplicity of data sources, as concluded in aforementioned MIT Sloan Management Review study, is what can give you the edge and competitive. And a faster lane to the insights. Pooling data from these tools can do wonders for your user engagement analysis.
Combining quantitative analytics solutions – like Google Analytics or Adobe Analytics, with event analytics and session replay tools – can give you the full picture and answers to all your user behavior questions. Add an A/B testing tool to the mix, paired with a feedback acquisition tool, you'll have a user engagement analytics powerhouse.
|
TIP: Find the best A/B testing software tools for your needs on G2. |
If you’re new to analytics and user engagement measurement and all seems daunting or complicated, don’t fret. Almost all highly rated tools have account management teams, customer success heroes, and support gurus that will answer all your questions and needs.
Every team in the company can use analytics for their own purposes. Marketing is the first team that gets associated with analytics and any user engagement measuring.
Traffic sources, referrals, campaigns, social media engagement, content interactions - in digital environment are all measurable and likely to be an object of the marketing team scrutiny. This stems from a basic necessity – of understanding the ROI of the activities.
Sales departments have a similar need. All their cold calls, cold emails and outreach campaigns can be and should be measured against their KPIs. That way the team knows where to focus and what to do.
Similarly, as expected from a customer facing team, customer success or support teams have their own array of metrics measuring user engagement, happiness, and satisfaction.
Next, product teams benefit from measuring user engagement in the product. Bounces, frictions, feature usage, time spent in product are all core metrics that are a gold mine of insights for product teams and developers. These days, if you’re working on a digital product, it’s absolutely pointless to develop features and ship products without a deep dive into the engagement metrics.
In the same, HR teams have been interested into understanding people engagement for a long time. It’s mostly about employment engagement, but it’s evident that HR teams are getting more curious about data and analytics. Also, it’s not far fetched to see how HR teams can be interested into understanding user behaviour on their job postings engagement on social media and how much time candidates spend on careers pages on their company website.
And finally, since the GDPR even the legal team is not immune to analytics and measurements bonanza. Their understanding of what gets measured and collected was crucial for the compliance. Sure, they don’t measure user engagement against some KPIs (maybe there are some outliers here). But still, to solidify the compliance they are (or at least should be) very well aware of the company wide data collection and analytics efforts.
Other teams? Those not so customer focused? Do they have value from tracking user engagement? Depends. Some have a clear benefit in understanding the users and their engagement. Others may just have a symbolic or enjoy the shared benefit as well.
Even though these teams usually work in a semi-connected silos, their measuring and user engagement analytics shouldn't be siloed. All of them can be managed within a single platform and within a one reporting point (a consumption point of sorts; a shared Business Intelligence tool). But again, ideally, pooling data from various complementing sources.
There’s an extreme value from an overarching and comprehensive user engagement analytics effort. Every company leader and subsequently team or department leaders benefits from the wide picture and complete user engagement understanding.
First, for the betterment of your company, product, or service, you need to recognize that understanding your users’ behavior is possible and it doesn’t require crazy investments. Second, start with a good set of questions and then investigate the best venues for answering them. Great questions, however tough, will guide you and your team through the entire endeavor.
Third, measuring and understanding user engagement works better on a company level. Clearly identified KPIs, OKRs – or whichever framework you use – work better when there’s a shared strategic goal and purpose. Fourth, there are many easy to use solutions and professionals that can help with the entire endeavor.
Still, try it on your own. Complete understanding, including metrics, methodology, and reporting is crucial for company-wide success. And today, there is really no easier way to improve your business and securing user satisfaction than getting into user engagement behavior analytics and related metrics.
Start using digital analytics software to help keep you on a journey toward understanding your user engagement analytics better. Find the right option for you on G2.
Nikola Kožuljević, Senior Campaign Manager at Smartlook. Romantically attached to SEO/SEM & Analytics - I love discovering stories from numbers and conversing with bots.
Are you wondering how to measure your content marketing ROI?
 by Georgios Chasiotis
All successful e-commerce campaigns are data-driven.
 by Anastasia Stefanuk
Email marketing is probably the most effective channel in terms of ROI.
 by Komal Helyer
Are you wondering how to measure your content marketing ROI?
 by Georgios Chasiotis
All successful e-commerce campaigns are data-driven.
 by Anastasia Stefanuk


