User experience (UX) can make or break your brand.
The way users interact with a website influences their perception of the business. If they face friction at every step, struggle to complete their actions, and cannot trust the website, why would they continue engaging with the brand?
Thus, user research is a non-negotiable part of the optimization process. It helps you understand the pulse of your users. And the most crucial step toward effective user research is conducting qualitative research.
With new technologies, conducting user research is fast, effortless, and aligns with the agility of modern businesses. You no longer need to work your fingers to the bone to analyze user behavior or increase UX.
In this article, we discuss traditional qualitative methods, the growing importance of user behavior analytics, best practices, and more.
Qualitative research is a methodology that provides insights into users' opinions, preferences, wants, and likes beyond mere numbers. These insights add context to the data collected through quantitative research methods.
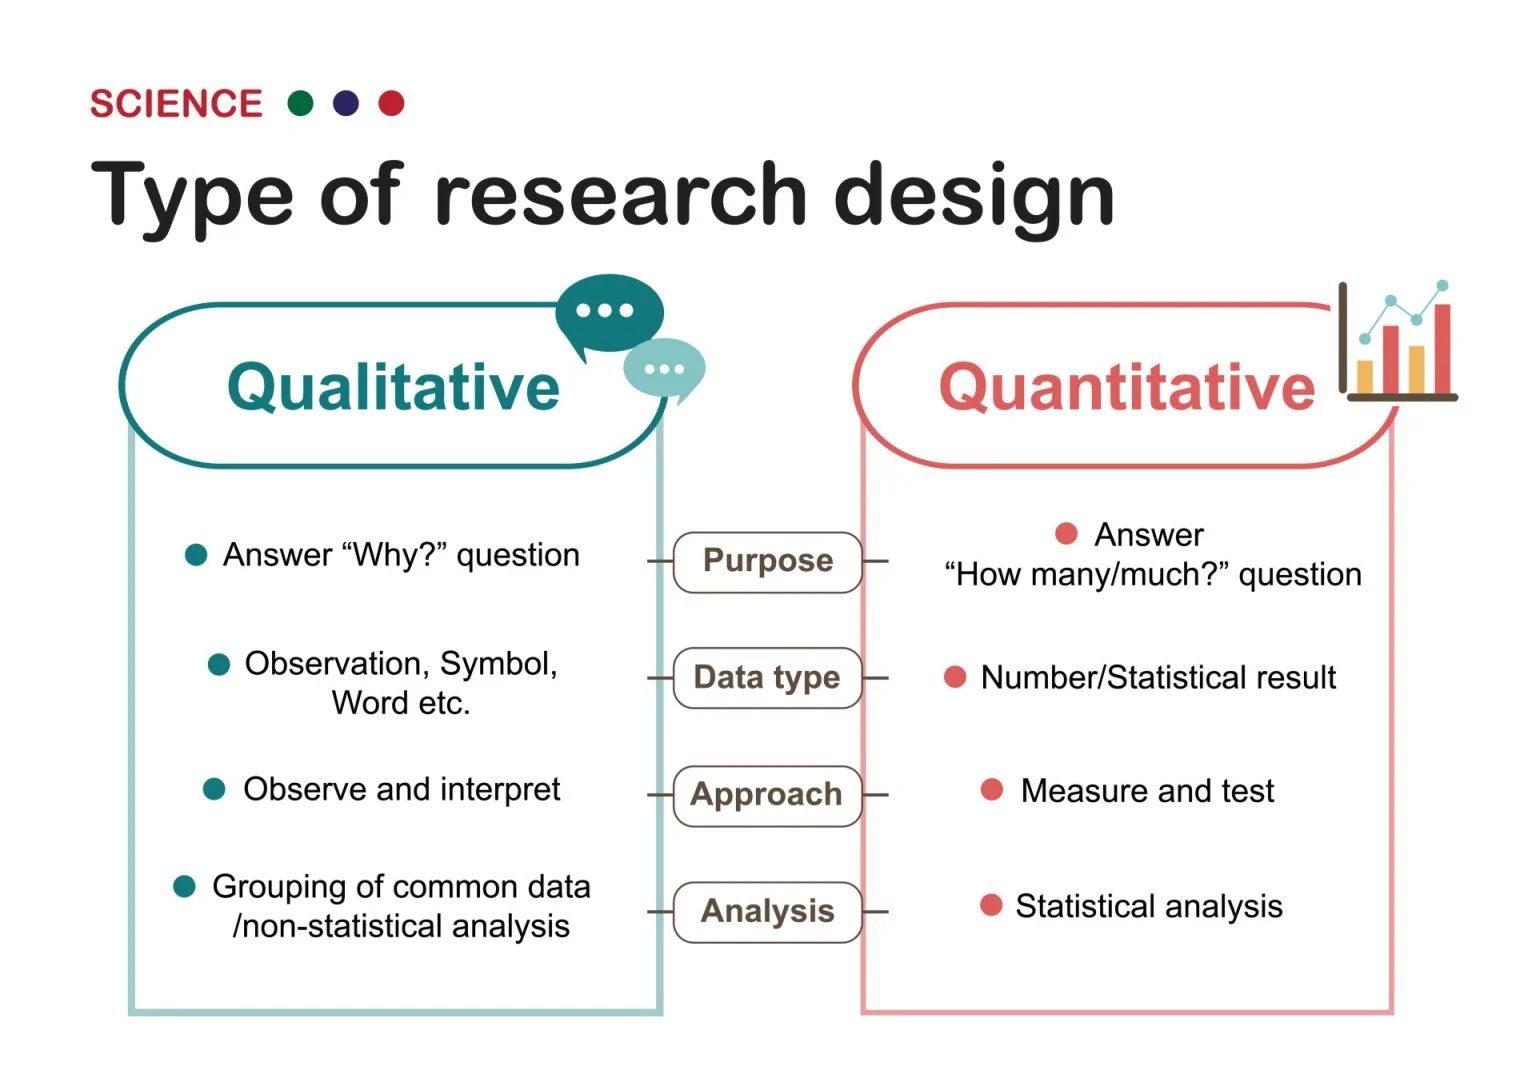
When it comes to understanding user behavior, both qualitative and quantitative research are valuable, but they serve different purposes. While quantitative data gives you the "what" of user behavior, such as which pages are most popular or how many users drop off during checkout, qualitative research uncovers the "why" behind these actions.
Source: SimplyPsychology
Here’s a look at the nuanced differences between these two main research methods:
Quantitative research focuses on analyzing numerical data and measuring metrics that reflect user engagement on your website. Qualitative research, on the other hand, helps you analyze users' motivation, pain points, and preferences that drive their actions.
Quantitative research deals with data in the form of graphs, charts, and tables filled with numbers. In contrast, information represented through text, audio, or visual formats is considered qualitative data.
The methods of collecting data for each of these research processes also differ. Website analytics, survey ratings, experiment results, or anything that shows data can be used for quantitative analyses. Whereas focus groups, interviews, and behavioral analytics are apt for collecting in-depth qualitative data about user behavior.
The scope of qualitative research in the field of UX is vast. Let's explore its use cases and benefits.
Qualitative research allows you to see the world through your users' eyes. By understanding their emotions toward your product, you can empathize with their needs, identify pain points, and polish the elements they appreciate.
When you place user insights at the core of product design and development, personal biases are minimized. The more your website aligns with the mental expectations of users, the better the user experience. This increases the conversion rates on your website as well.
Understanding why users meet friction informs you about the changes needed, the reasons for those changes, and the expected outcomes. An informed hypothesis will increase the likelihood of a test producing an improved variation and more conversions.
Traditional qualitative research methods have been the cornerstone of user behavior analysis for decades. Each method provides a unique lens to view user interactions, helping you tailor your products or services to better meet their needs. Let's explore how.
In-depth interviews enable you to collect detailed qualitative insights by asking users open-ended questions. Although you can prepare a set questionnaire covering several topics, these interviews also grant the flexibility to ask additional follow-up questions to explore areas that may offer deeper insights into user behavior motivations.
Focus groups involve gathering qualitative insights from a group of participants about a specific topic. The moderator guides the discussion, ensuring everyone has an equal chance to voice their opinions.
In traditional surveys, a series of questions is asked through paper forms, phone interviews, or emails. In contrast to interviews, which are done one-on-one, survey questions are distributed to a sample size representing your overall user base.
Secondary research is used to collect user insights from existing qualitative data to find answers to your research question. The data can be sourced from journals, past surveys, articles, or publication sources.
Apart from all the above pros and cons, traditional methods are generally time and resource-intensive, which might make them unsuitable for modern businesses that require quick and reliable user insights.
Let’s explore alternative approaches.
The most effective solution to the challenges posed by traditional qualitative research methods is user behavior analytics. By analyzing user engagement on your website or digital products of any kind, you can optimize user experience, leading to improved engagement and increased conversions.
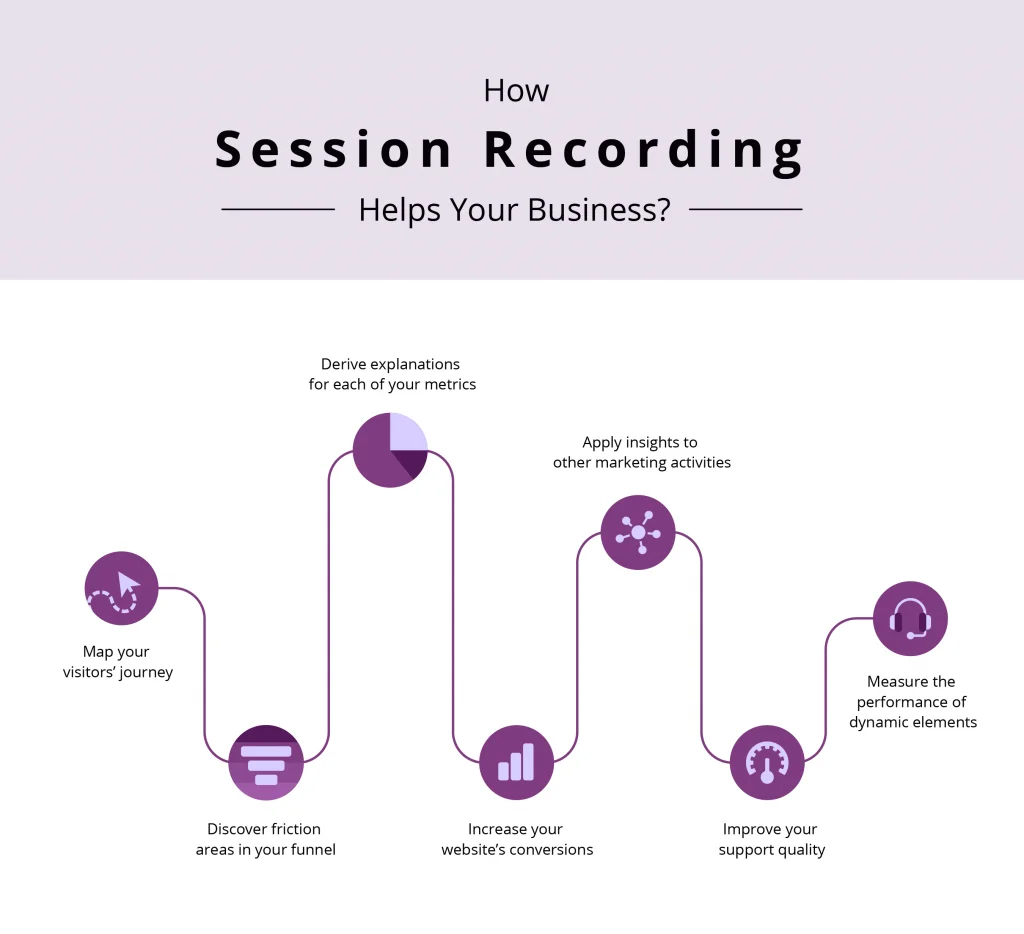
Session recordings capture video footage of users’ interactions on your website, showing their clicks, mouse trails, and navigation paths. This helps identify which areas users engage with the most, where they face difficulties, or where they pause, indicating potential friction. Based on these observations, you can develop strategies to improve user experience.
Source: VWO
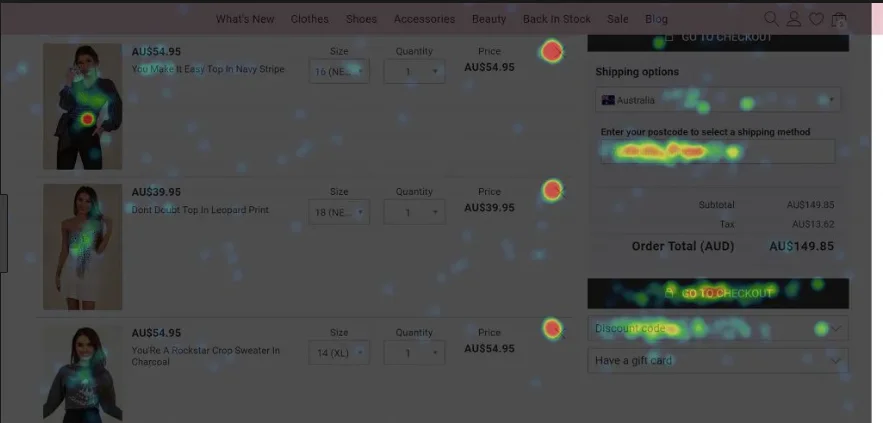
Heatmaps are two-dimensional visual representations of user behavior on your website. By using color gradients, heatmaps show which areas receive the most engagement. Warm colors like red and orange indicate areas with the highest engagement, while cool colors like blue and green display low engagement areas.
Clickmaps and scrollmaps are two variations of heatmaps, with the former showing the number of clicks on each area and the latter indicating how far users scroll down a page.
Source: VWO
Let us see how traditional qualitative research and user behavior analytics weigh against each other on key parameters.
Collecting large amounts of data through traditional methods is often impractical due to their resource-intensive nature. In contrast, user behavior analytics lets you collect data from numerous users, allowing for quicker analysis and decision-making. Simply add the tracker of the tool on your website, follow a few additional steps based on the tool you use, and you’re good to go.
Traditional methods can lead to outdated insights since data analysis only occurs after significant data collection. This delays the entire process of implementing an optimization idea. However, since user behavior analytics tools continuously collect data on user interaction with your website, this leads to faster identification of problems and prompt actions.
Surveys, focus groups, or interviews can only capture user feedback or behaviors after they have interacted with your website or brand. They cannot track the entire user journey, from landing to conversion or drop-off. This way, you may miss out on a lot of details in the user journey. Conversely, user behavior analytics offers insights into the entire user journey, helping you find and fix leaky buckets on your website.
Traditional methods are susceptible to bias, as the phrasing and tone of questions can influence responses. User feedback can also be sugarcoated to come across as polite and distort the true picture of user behavior. With user behavior analytics, you can collect real-time data based on actual user behavior on your website.
Real-world examples provide compelling evidence of how user behavior analytics can command significant growth and optimization.
Flos, a modern lighting solutions company in Merano, Italy, faced a low checkout rate on its U.S. subsidiary’s website. By utilizing heatmaps, scrollmaps, and recordings, the company analyzed user behavior at every touchpoint.
Based on the data, every touchpoint needed improvement to remove the friction from the user journey. Implementing these learnings across the website resulted in a 125% increase in the check-out rate.
A Paris-based video game publisher company, Ubisoft, combined data from different types of user behavior analytics tools to improve lead generation. Seeing considerable friction in the user journey, the team decided to revamp the page completely, leading to a 12% increase in sign-ins.
The effectiveness of your research depends not just on the tools you use but on how you use them. To truly capitalize on the power of qualitative research, it's best to approach it with a clear strategy and best practices in mind.
Users will navigate through and interact with various elements on a page before engaging with specific elements that really matter. Set clear research objectives to ensure you:
For example, as a product marketer, if you want to see if the newly designed 'free trial' button on the homepage is getting enough clicks, focus on engagement with that CTA.
Click heatmaps can show the number of clicks the button receives, and recordings can reveal if there are any instances of rage clicks, dead clicks, or pauses around the button. Since your research objective is decided, you won't get distracted by other data, such as scroll depth or clicks on banners. This helps optimize your efforts and saves time.
User research is vast, and relying on a single tool can be limiting.
Complement your research with insights from other behavior analytics tools like surveys. On-page surveys are different from traditional surveys since you can set them on any relevant page of your website and ask questions based on your goal.
Similarly, form analytics lets you dive deep into field-level analysis, adding to the insights gained through heatmaps and recordings.
Imagine you are a UX researcher investigating the reasons behind a low checkout rate. Form analytics can reveal issues beyond heatmaps or recording and help you understand which fields users find confusing, drop off from, and hesitate to fill. Similarly, surveys disclose the problems users face that stop them from moving forward in the journey.
Avoid relying on a single tool for data analysis. High clicks on a button may seem positive, but further investigation might uncover dead clicks or user frustration.
For example, if heatmaps show maximum clicks on a product image, you should check recordings if these are dead clicks. Always question and dig deeper into user behavior by using additional tools or surveys to gain a comprehensive understanding. If users try to zoom in but the image is fixed, you might hypothesize that adding a zoom feature could reduce user friction. Such interpretations at every step are necessary to view user behavior in the right context, ensuring that improvements are based on a sound premise.
For a more holistic understanding of user behavior, combine quantitative data with qualitative data. Start by looking at your analytics tool to see website metrics such as bounce rate, conversion, page views, and average session duration. Once you identify these issues through quantitative data, use user behavior analytics to understand the "why" behind these numbers.
Let's say you notice a high bounce rate on your ad campaign's landing page during a regular performance check-up. Check heatmaps and recordings to identify friction points in the user journey. Don't stop at collecting insights and making changes. Complete the process by returning to your analytics tools to see if the improvements have reduced bounces. Remember, using both methods will provide more comprehensive insights than relying on just one approach.
As technology continues to evolve, so does qualitative research. Understanding these future trends is key to staying ahead of the curve and making sure that your research methods remain relevant and effective.
We are likely to soon witness bigger applications of AI and ML in automating data analysis and gathering insights from a large number of unstructured data. These technologies can analyze text, see patterns, and suggest actions for you to implement, saving time and effort.
For example, an AI-powered survey tool can analyze survey responses and offer summarized versions, saving you from the hassle of going through hundreds of responses.
As businesses aspire to stay ahead of the competition, real-time data collection and analysis have climbed in relevance.
A real-time user behavior platform could alert you if a new landing page receives low engagement, allowing immediate investigation and optimization.
Predictive qualitative research helps you anticipate future trends and behaviors based on current and historical data. Researchers can identify emerging patterns and make proactive decisions. This approach helps organizations stay ahead of the competition and tailor strategies to anticipated user needs and preferences.
Consider an AI feature that analyzes user behavior and feedback to predict growing demand for a particular feature or product on your website. This prediction can help you take proactive steps to meet user needs.
The accessibility of qualitative insights, thanks to user behavior analytics, should encourage more businesses to adopt this method. A deeper understanding of your users will lead to better website optimization, higher engagement, and increased conversions, ultimately driving greater business success.
Get closer to your audience with smarter research methods!
Edited by Monishka Agrawal

You know that feeling when you’re asked “What do you want for dinner tonight?” and you’re...
 by Holly Hunt

The road to bootstrapping a SaaS company is full of hurdles. But for product connoisseurs, it...
 by Ben Robinson

Understanding what your users truly want is the foundation of building products they love, but...
.png) by Devyani Mehta
by Devyani Mehta