.png?width=400&height=150&name=Untitled%20design%20(56).png)

Life is full of binary choices — have that slice of pizza or skip it, carry an umbrella or take a chance. Some decisions are simple, others unpredictable.
Predicting the right outcome requires data and probability. These are skills that computers excel at. Since computers speak in binary, they’re great at solving yes-or-no problems.
That’s where machine learning software, specifically the logistic regression algorithm, comes in. It helps predict the likelihood of events based on historical data, like whether it’ll rain today or if a customer will make a purchase.
Logistic regression is a statistical method used to predict the outcome of a dependent variable based on previous observations. It's a type of regression analysis and is a commonly used algorithm for solving binary classification problems.
Regression analysis is a predictive modeling technique that finds the relationship between a dependent variable and one or more independent variables.
For example, time spent studying and time spent on Instagram (independent variables) affect grades (the dependent variable) — one positively, the other negatively.
Logistic regression builds on this concept to predict binary outcomes, like whether you’ll pass or fail a class. While it can handle regression tasks, it’s primarily used for classification problems.
For instance, logistic regression can predict whether a student will be accepted into a university based on factors such as SAT scores, GPA, and extracurricular activities. Using past data, it classifies outcomes as “accept” or “reject.”
Also known as binomial logistic regression, it becomes multinomial when predicting more than two outcomes. Borrowed from statistics, it’s one of the most widely used binary classification algorithms in machine learning.
Logistic regression measures the relationship between the dependent variable (the outcome) and one or more independent variables (the features). It estimates the probability of an event using a logistic function.
While logistic regression predicts the categorical variable for one or more independent variables, linear regression predicts the continuous variable. In other words, logistic regression provides a constant output, whereas linear regression offers a continuous output.
Since the outcome is continuous in linear regression, there are an infinite number of possible values for the outcome. But for logistic regression, the number of possible outcome values is limited.
In linear regression, the dependent and independent variables should be linearly related. In the case of logistic regression, the independent variables should be linearly related to the log odds (log (p/(1-p)).
Tip: Logistic regression can be implemented in any programming language used for data analysis, such as R, Python, Java, and MATLAB.
While linear regression is estimated using the ordinary least squares method, logistic regression is estimated using the maximum likelihood estimation approach.
Both logistic and linear regression are supervised machine learning algorithms, and they are the two main types of regression analysis. While logistic regression is used to solve classification problems, linear regression is primarily used for regression problems.
| Feature | Logistic Regression | Linear Regression |
| Output Type | Categorical (0 or 1) | Continuous (any number) |
| Algorithm Type | Classification | Regression |
| Function Used | Sigmoid (logistic) | Linear equation |
| Output Interpretation | Probability of class | Predicted value |
| Common Use Cases | Fraud detection, churn, spam | Sales forecasting, pricing, trends |
Returning to the example of time spent studying, linear regression and logistic regression can be used to predict different outcomes. Logistic regression can help predict whether the student passed an exam or not. In contrast, linear regression can predict the student's score.
You can think of logistic regression as a process or pipeline:
Raw data ➝ clean data ➝ feature engineering ➝ model training ➝ probability prediction ➝ yes/no output
Here’s how it works behind the scenes:
Step 1: Take the input data (independent variables)
These factors influence the outcome, including age, income, and time on site. In technical terms, these are your independent variables (often labeled X₁, X₂, X₃, and so on).
Step 2: Assign importance (coefficients or weights)
The model learns the importance of each input. It gives each one a weight — kind of like saying, “This factor matters more than that one.”
Step 3: Combine everything into a single score
The model multiplies each input by its weight and adds them together. This yields a score, technically referred to as a “linear combination.” Think of it like mixing ingredients to make a dish. The model combines your inputs into one value.
Step 4: Convert the score to a probability (sigmoid function)
The combined score could be any number, positive or negative. But we want a probability between 0 and 1. To achieve this, logistic regression employs a special formula called the logistic (sigmoid) function, which compresses the number into a value such as 0.2 (low chance) or 0.9 (high chance).
Step 5: Make a prediction (yes or no)
Finally, the model draws a line in the sand, usually at 0.5. If the probability is above 0.5, it predicts yes (e.g., the customer will buy). If it’s below 0.5, it predicts no.
This whole process transforms raw data into a clear, interpretable result — plus it gives you the probability behind the decision, so you know how confident the model is.
Now that you understand how logistic regression makes predictions, let’s explore the key assumptions that must be met for it to work correctly.
Logistic regression is named after the function used at its heart, the logistic function. Statisticians initially used it to describe the properties of population growth. The sigmoid function and the logit function are some variations of the logistic function. The logit function is the inverse of the standard logistic function.
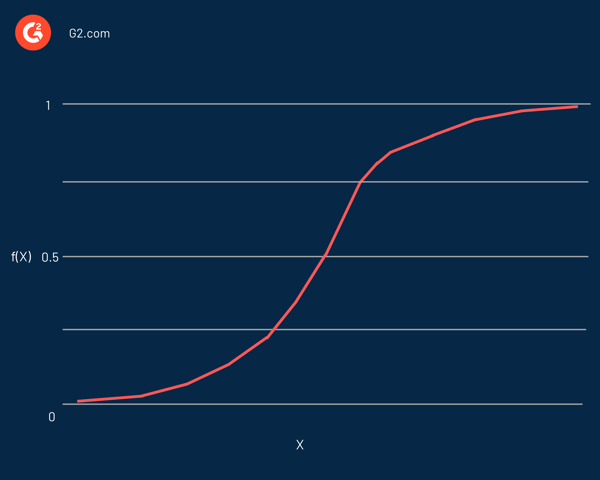
In effect, it's an S-shaped curve capable of mapping any real number into a value between 0 and 1, but never precisely at those limits. It's represented by the equation:
f(x) = L / 1 + e^-k(x - x0)
In this equation:
If the predicted value is a considerable negative value, it's considered close to zero. On the other hand, if the predicted value is a significant positive value, it's considered close to one.
Logistic regression is represented similarly to linear regression, defined using the equation of a straight line. A notable difference from linear regression is that the output will be a binary value (0 or 1) rather than a numerical value.
Here’s an example of a logistic regression equation:
y = e^(b0 + b1*x) / (1 + e^(b0 + b1*x))
In this equation:
The dependent variable generally follows the Bernoulli distribution. The values of the coefficients are estimated using maximum likelihood estimation (MLE), gradient descent, and stochastic gradient descent.
As with other classification algorithms, like the k-nearest neighbors, a confusion matrix is used to evaluate the accuracy of the logistic regression algorithm.
Did you know? Logistic regression is a part of a larger family of generalized linear models (GLMs).
Just like evaluating the performance of a classifier, it's equally important to know why the model classified an observation in a particular way. In other words, we need the classifier's decision to be interpretable.
Although interpretability isn't easy to define, its primary intent is that humans should know why an algorithm made a particular decision. In the case of logistic regression, it can be combined with statistical tests, such as the Wald test or the likelihood ratio test, for enhanced interpretability.
Logistic regression can be divided into different types based on the number of outcomes or categories of the dependent variable.
When we think of logistic regression, we most probably think of binary logistic regression. Throughout most of this article, when we referred to logistic regression, we were specifically referring to binary logistic regression.
The following are the three main types of logistic regression.
Binary logistic regression is the most commonly used form of logistic regression. It models the probability of a binary outcome — that is, an outcome that can take on only two possible values, such as “yes” or “no,” “spam” or “not spam,” “pass” or “fail,” and “0” or “1.” The algorithm estimates the likelihood that a certain input belongs to one of the two classes, based on one or more predictor variables.
This method is widely used across industries:
Mathematically, binary logistic regression calculates the log-odds of the dependent variable as a linear combination of the independent variables. This log-odds is then transformed into a probability using the logistic (sigmoid) function.
Binary logistic regression is ideal when:
Example: A spam classifier that takes features like email length, keyword frequency, and sender reputation and outputs a probability of the message being spam.
Multinomial logistic regression is an extension of binary logistic regression used when the dependent variable has more than two unordered categories. Unlike binary logistic regression, where the outcome is either 0 or 1, multinomial regression handles three or more nominal (non-ordinal) classes.
Common examples include:
The model estimates the probabilities of each class relative to a reference category. This involves fitting separate binary logistic models for each class versus the reference class, then combining the results to make a final prediction.
Multinomial logistic regression works best when:
It is also more computationally intensive than binary regression, but highly useful when there are multiple outcome choices that don’t follow a natural order.
Ordinal logistic regression, also called ordinal regression, is used when the dependent variable consists of three or more ordered categories. The categories have a meaningful order, but the spacing between them is unknown — for instance, “Poor,” “Average,” “Good,” or customer ratings such as 1 to 5 stars.
Use cases include:
Unlike multinomial logistic regression, ordinal regression assumes the proportional odds assumption, which means that the relationship between each pair of outcome groups remains constant. This assumption helps simplify the model and interpretation of coefficients.
Ordinal logistic regression is appropriate when:
The model calculates the log-odds of being at or below a certain category and then applies the logistic function to compute cumulative probabilities. This makes it a powerful tool when both classification and ranking are important.
Did you know? An artificial neural network (ANN) representation can be seen as stacking together a large number of logistic regression classifiers.
Logistic regression is applied to predict the categorical dependent variable. In other words, it's used when the prediction is categorical, for example, yes or no, true or false, 0 or 1. The predicted probability or output of logistic regression can be either one of them, and there's no middle ground.
In the case of predictor variables, they can be part of any of the following categories:
Logistic regression analysis is valuable for predicting the likelihood of an event. It helps determine the probabilities between any two classes.
In a nutshell, by looking at historical data, logistic regression can predict whether:
In essence, logistic regression helps solve problems related to probability and classification. In other words, you can expect only classification and probability outcomes from logistic regression.
For example, it can be used to find the probability of something being “true or false” and also for deciding between two outcomes like “yes or no”.
A logistic regression model can also help classify data for extract, transform, and load (ETL) operations. Logistic regression shouldn't be used if the number of observations is less than the number of features. Otherwise, it may lead to overfitting.
These tools can help you run logistic regression models, visualize results, and interpret coefficients, all without writing complex code.
*These statistical analysis software solutions are top-rated in their category, according to G2's Fall 2025 Grid Reports.
Logistic regression is simple, fast, and easy to interpret, but it’s not always the best tool. Here are situations where it might fall short:
Logistic regression assumes that the inputs relate linearly to the log-odds of the outcome. If the actual relationship is complex or nonlinear, the model might oversimplify and make inaccurate predictions.
If you have more features (inputs) than observations (rows of data), logistic regression can overfit — meaning it performs well on training data but poorly on new data. It needs a reasonable number of examples to generalize well.
Multicollinearity (when two or more features move in tandem) can compromise the model’s ability to assign proper weights. It becomes hard to know which variable is actually influencing the outcome.
Logistic regression creates straight-line (linear) decision boundaries. If your data is complicated, models like:
Bottom line: Logistic regression is a great starting point, but it's not a one-size-fits-all solution. Know its limits before choosing it as your go-to model.
Many of the advantages and disadvantages of the logistic regression model apply to the linear regression model. One of the most significant advantages of the logistic regression model is that it not only classifies but also provides probabilities.
The following are some of the advantages of the logistic regression algorithm.
Logistic regression is a great first step into machine learning — it’s simple, fast, and often surprisingly effective. But like any tool, it has its quirks. Here are some common pitfalls beginners run into, and what you can do about them:
Logistic regression draws straight-line (linear) boundaries between classes. If your data has curves or complex patterns, it may underperform. While you can try transforming features (e.g., log, polynomial), models like decision trees or neural nets are better for non-linear problems.
If you have more features than observations, the model might overfit — meaning it learns noise instead of useful patterns. This results in poor performance on new data. Use regularization (such as L1 or L2) or reduce the number of features through feature selection or dimensionality reduction.
When one feature perfectly predicts the outcome (e.g., all “yes” values have income > $100K), logistic regression struggles — the weight for that feature goes toward infinity. This is called complete separation, and the model may fail to converge. Use regularization or Bayesian logistic regression to constrain the weights.
If two or more input features are highly correlated, the model can’t distinguish their individual effects clearly. This makes the coefficient estimates unstable and hard to interpret. Check for multicollinearity using the Variance Inflation Factor (VIF) and drop or combine redundant features.
Logistic regression can be thrown off by extreme values, especially in small datasets. Outliers can disproportionately influence the weights, leading to skewed predictions.Use robust scaling methods, or remove/transform extreme values.
It’s easy to mistake log-odds for probabilities or read coefficients as direct impacts on the output. Logistic regression coefficients affect the log-odds, not the raw probability. Convert coefficients to odds ratios to understand the direction and strength of effect.
Many of these pitfalls are easy to miss when you’re starting out. The good news? Once you know what to watch for, logistic regression becomes a reliable and interpretable workhorse for many binary classification problems.
If you're curious about how logistic regression works in practice, here's a beginner-friendly walkthrough of how a simple model is built — from raw data to prediction.
No need to be a data scientist to start experimenting; tools like Python’s scikit-learn make it easier than ever to build simple models.
Logistic regression is a supervised learning algorithm. It learns from labeled training data to classify outcomes.
Linear regression predicts continuous outcomes (like price), while logistic regression predicts binary outcomes (like yes/no).
The key assumptions include the linearity of log-odds, the absence of multicollinearity, and a binary dependent variable (for binary logistic regression).
Yes, that’s called multinomial or ordinal logistic regression, depending on whether the classes have an order.
It’s ideal when your target variable is categorical (yes/no) and your data meet assumptions such as linearity in log-odds and low multicollinearity.
Some might say life isn’t binary, but more often than not, it is. Whether you're deciding to send that email campaign or skip dessert, many choices boil down to simple yes-or-no decisions. That’s exactly where logistic regression shines.
It helps us make sense of uncertainty by using data, rather than relying on gut instinct. From predicting customer churn to flagging fraudulent transactions, logistic regression enables businesses to make smarter, more informed decisions.
Discover the top predictive analytics tools that simplify logistic regression and help you build, train, and deploy prediction models in less time.
This article was originally published in 2021. It has been updated with new information.
.png)

Backpropagation sits at the heart of neural networks, where it helps deep learning models...
 by Sagar Joshi

Cross-validation is an invaluable tool for data scientists.
 by Amal Joby

Isn't linear regression part of statistics?
by Amal Joby