Isn't linear regression part of statistics?
Undoubtedly, yes.
In fact, most machine learning (ML) algorithms are borrowed from various fields, mainly statistics. Anything that can help models predict better will eventually become part of ML. So, it's safe to say that linear regression is both a statistical and a machine learning algorithm.
Linear regression is a popular and uncomplicated algorithm used in data science and machine learning. It's a supervised learning algorithm and the simplest form of regression used to study the mathematical relationship between variables.
Linear regression is a statistical method that tries to show a relationship between variables. It looks at different data points and plots a trend line. A simple example of linear regression is finding that the cost of repairing a piece of machinery increases with time.
More precisely, linear regression is used to determine the character and strength of the association between a dependent variable and a series of other independent variables. It helps create models to make predictions, such as predicting a company's stock price.
Before trying to fit a linear model to the observed dataset, one should assess whether or not there is a relationship between the variables. Of course, this doesn't mean that one variable causes the other, but there should be some visible correlation between them.
For example, higher college grades don't necessarily mean a higher salary package. But there can be an association between the two variables.
Did you know? The term “linear” means resembling a line or pertaining to lines.
Creating a scatter plot is ideal for determining the strength of the relationship between explanatory (independent) and dependent variables. If the scatter plot doesn't show any increasing or decreasing trends, applying a linear regression model to the observed values may not be beneficial.
Correlation coefficients are used to calculate how strong a relationship is between two variables. It's usually denoted by r and has a value between -1 and 1. A positive correlation coefficient value indicates a positive relationship between the variables. Likewise, a negative value indicates a negative relationship between the variables.
Tip: Perform regression analysis only if the correlation coefficient is either positive or negative 0.50 or beyond.
If you were looking at the relationship between study time and grades, you’d probably see a positive relationship. On the other hand, if you look at the relationship between time on social media and grades, you'll most likely see a negative relationship.
Here, “grades” is the dependent variable, and time spent studying or on social media is the independent variable. This is because grades depend t on how much time you spend studying.
If you can establish (at least) a moderate correlation between the variables through both a scatter plot and a correlation coefficient, then the said variables have some form of a linear relationship.
In short, linear regression tries to model the relationship between two variables by applying a linear equation to the observed data. A linear regression line can be represented using the equation of a straight line:
y = mx + b
In this simple linear regression equation:
Finding the relationship between variables makes it possible to predict values or outcomes. In other words, linear regression makes it possible to predict new values based on existing data.
An example would be predicting crop yields based on the rainfall received. In this case, rainfall is the independent variable, and crop yield (the predicted values) is the dependent variable.
Independent variables are also referred to as predictor variables. Likewise, dependent variables are also known as response variables.
Understanding linear regression analysis would also mean getting familiar with a bunch of new terms. If you have just stepped into the world of statistics or machine learning, having a fair understanding of these terminologies would be helpful.
There are two types of linear regression: simple linear regression and multiple linear regression.
The simple linear regression method tries to find the relationship between a single independent variable and a corresponding dependent variable. The independent variable is the input, and the corresponding dependent variable is the output.
Tip: You can implement linear regression in various programming languages and environments, including Python, R, MATLAB, and Excel.
The multiple linear regression method tries to find the relationship between two or more independent variables and the corresponding dependent variable. There's also a special case of multiple linear regression called polynomial regression.
Simply put, a simple linear regression model has only a single independent variable, whereas a multiple linear regression model will have two or more independent variables. And yes, there are other non-linear regression methods used for highly complicated data analysis.
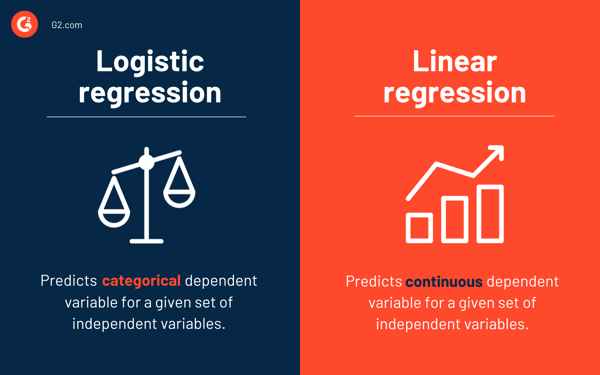
While linear regression predicts the continuous dependent variable for a given set of independent variables, logistic regression predicts the categorical dependent variable.
Both are supervised learning methods. But while linear regression is used to solve regression problems, logistic regression is used to solve classification problems.
Of course, logistic regression can solve regression problems, but it's mainly used for classification problems. Its output can only be 0 or 1. It's valuable in situations where you need to determine the probabilities between two classes or, in other words, calculate the likelihood of an event. For example, logistic regression can be used to predict whether it’ll rain today.
While using linear regression to model the relationship between variables, we make a few assumptions. Assumptions are necessary conditions that should be met before we use a model to make predictions.
There are generally four assumptions associated with linear regression models:
In machine learning or statistics lingo, learning a linear regression model means guessing the coefficients' values using the data available. Several methods can be applied to a linear regression model to make it more efficient.
Tip: Use machine learning software to eliminate monotonous tasks and make accurate predictions.
Let’s look at the different techniques used to solve linear regression models to understand their differences and trade-offs.
As mentioned earlier, there are a single input or one independent variable and one dependent variable in simple linear regression. It's used to find the best relationship between two variables, given that they're in continuous nature. For example, it can be used to predict the amount of weight gained based on the calories consumed.
Ordinary least squares regression is another method to estimate the value of coefficients when there is more than one independent variable or input. It's one of the most common approaches for solving linear regression and is also known as a normal equation.
This procedure tries to minimize the sum of the squared residuals. It treats data as a matrix and utilizes linear algebra operations to determine the optimal values for each coefficient. Of course, this method can be applied only if we have access to all data, and there should also be enough memory to fit the data.
Gradient descent is one of the easiest and commonly used methods to solve linear regression problems. It's useful when there are one or more inputs and involves optimizing the value of coefficients by minimizing the model's error iteratively.
Gradient descent starts with random values for every coefficient. For every pair of input and output values, the sum of the squared errors is calculated. It uses a scale factor as the learning rate, and each coefficient is updated in the direction to minimize error.
The process is repeated until no further improvements are possible or a minimum sum of squares is achieved. Gradient descent is helpful when there's a large dataset involving large numbers of rows and columns that won't fit in the memory.
Regularization is a method that attempts to minimize the sum of the squared errors of a model and, at the same time, reduce the complexity of the model. It reduces the sum of squared errors using the ordinary least squares method.
Lasso regression and ridge regression are the two famous examples of regularization in linear regression. These methods are valuable when there's collinearity in the independent variables.
Adaptive moment estimation, or ADAM, is an optimization algorithm used in deep learning. It's an iterative algorithm that performs well on noisy data. It's straightforward to implement, computationally efficient, and has minimal memory requirements.
ADAM combines two gradient descent algorithms – root mean square propagation (RMSprop) and adaptive gradient descent. Instead of using the entire dataset to calculate the gradient, ADAM uses randomly selected subsets to make a stochastic approximation.
ADAM is suitable for problems involving a large number of parameters or data. Also, in this optimization method, the hyperparameters generally require minimal tuning and have intuitive interpretation.
Singular value decomposition, or SVD, is a commonly used dimensionality reduction technique in linear regression. It's a preprocessing step that reduces the number of dimensions for the learning algorithm.
SVD involves breaking down a matrix as a product of three other matrices. It's suitable for high-dimensional data and efficient and stable for small datasets. Due to its stability, it's one of the most preferred approaches for solving linear equations for linear regression. However, it's susceptible to outliers and might get unstable with a huge dataset.
Real-world data, in most cases, are incomplete.
Like any other machine learning model, data preparation and preprocessing is a crucial process in linear regression. There will be missing values, errors, outliers, inconsistencies, and a lack of attribute values.
Here are some ways to account for incomplete data and create a more reliable prediction model.
Linear regression is one of the most uncomplicated algorithms to comprehend and simplest to implement. It's a great tool to analyze relationships between variables.
Here are some notable advantages of linear regression:
However, linear regression isn't generally recommended for the majority of practical applications. It's because it oversimplifies real-world problems by assuming a linear relationship between variables.
Here are some disadvantages of linear regression:
In linear regression, it's crucial to evaluate whether the variables have a linear relationship. Although some people do try to predict without looking at the trend, it's best to ensure there's a moderately strong correlation between variables.
As mentioned earlier, looking at the scatter plot and correlation coefficient are excellent methods. And yes, even if the correlation is high, it's still better to look at the scatter plot. In short, if the data is visually linear, then linear regression analysis is feasible.
While linear regression lets you predict the value of a dependent variable, there's an algorithm that classifies new data points or predicts their values by looking at their neighbors. It's called the k-nearest neighbors algorithm, and it's a lazy learner.


As a business owner, you always want to know how much goes into making your products. From...
 by Soundarya Jayaraman

Life is full of binary choices — have that slice of pizza or skip it, carry an umbrella or...
.png) by Devyani Mehta
by Devyani Mehta

Cross-validation is an invaluable tool for data scientists.
by Amal Joby