

You’re awakened by an alert tone and unsure of the time, but it’s dark outside and as you start to regain consciousness you see notifications flooding in.
Something has crashed your application, and users in Europe are quite perturbed. An hour has passed with no backup, save your customer service manager asking dutifully every 15 minutes when you expect a return to normalcy. The two of you watch as the rest of your team wakes up, receives the news, and starts pointing fingers.
This entire situation is avoidable, you think, as the fourth hour of downtime crests. If only something had warned us of our impending doom.
Welcome to the world of website monitoring, where application uptime is the prime directive. Maybe this wasn’t quite how your 3 a.m. fire went down, but if you've survived this long in DevOps, you’ve had one – and we’ll bet it wasn’t pleasant.
If your goal is to minimize this unique brand of pain then we are here to help you make on-call suck a little less with an easy to skim guide that lays out what you need in a web monitoring provider.
Let’s begin with the fundamentals: monitoring and reporting. Much like the all-seeing telescreens of 1984, monitoring here refers to “external” oversight of your operations. External probe servers are typically used to monitor the state of your application.
Accountability begins with oversight, or rather observability. What can you learn based on what your infrastructure is telling you?
Reporting quantifies your accountability, but good reporting is subjective. Some might like raw data they can package into any format. Others want automated reports delivered, some heavy on numbers others desiring a more visual approach. Reporting is the other side of monitoring and getting these two elements right will ensure your application remains accessible, and your service level agreements are met.
The better you understand your infrastructure, the more value you get from monitoring. Providers often parse out check types to keep costs low. Understanding the web monitoring needs of your infrastructure is a good source of cost savings.
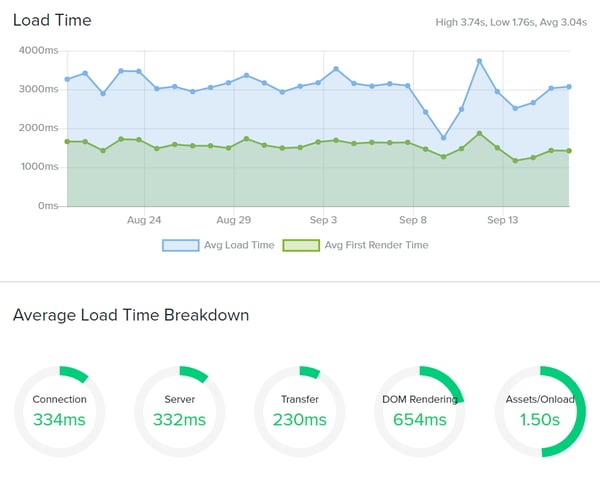
Monitoring is not merely about catching your server gnomes asleep on the job, it should tell you more than if the service is up or down. Through performance metrics, you can develop a clear picture of how your infrastructure operates. Especially with more advanced checks, such as real user monitoring (RUM) – but more on that later.
Check your vendor’s status page, and sift through their previous six to 12 months of outage data. Is the vendor down frequently? Their overall uptime and incident management should provide clues into their reliability.
Before selecting a provider you want to assess your needs. Answer this, what would wake you in the middle of the night? That infrastructure should be among the first components you configure as you test providers.
Strategize a plan of attack for monitoring, and make a list of your must have services. Service providers offering set plans can help or hurt here. Good plans take into account the size of the businesses using them. It never hurts to ask about your options for upgrades and add-ons to customize your plan.
Maybe what prompted your search for a web monitor was a 404 or an SSL error, but leave yourself room to experiment and grow. As you test, you will no doubt find additional ways to monitor your system and use your check allocations.
Basic checks usually do one thing only, like monitoring a single URL or checking DNS records. These check types usually prompt someone to search for monitoring, typically after an outage has occurred. Getting this right is important.
HTTP(S), SSL, DNS, and Domain Expiry are some good basic checks to keep in mind because these are the kinds of outages the end user tends to feel. These checks also make up the monitoring backbone of most enterprise users. Plans that only incorporate these check types are strong “starter” plans for startups and small businesses.
HTTP(S) checks, sometimes called “web monitoring”, monitor for uptime. SSL, DNS, and Domain Expiry tend to ensure critical infrastructure isn’t failing for preventable reasons. If your provider also includes performance metrics, that’s a clear bonus.
Make sure your provider supports alert delivery where you need it. If you had an upcoming SSL expiry, it would be helpful to shuffle past the bureaucracy and put that notice directly in front of the person who can pay for the renewal with ample time for them to renew. It would be even better if the issue could escalate automatically to someone else if more expertise were needed.
An advanced check is one that either uses real user data, or bases its actions on user actions. These complex check types usually require some setup effort. The payoff can be monumental for organizations who use them.
Advanced check types oversee critical goal or navigation funnels, like logging in or purchasing an item. Because they act like (or sometimes draw data from) real users, these checks give a clear picture of your site’s performance under various conditions.
Why invest the effort to setup these check types?
Let’s meet James and see how multiple check types prove useful:
James is launching a new product for his company, Edgeco. This new service will require its own security certificate, alongside new infrastructure. James will deploy this service with real user monitoring so he learns more about the early user experience. SSL monitoring will ensure that when James moves onto other projects, his certificate will have safeguards in place to ensure renewal is not forgotten.
With an HTTP(S) check monitoring this URL, James and his team have first-response capabilities when downtime is detected. Using a transaction check, James can test critical user flows, such as logging into the new service and using its core components.
Because James deployed with Real User Monitoring, his service has gathered usage statistics throughout every change he and his team have made during the service’s lifespan. Within six months, James will have enough data to identify performance issues localized to specific regions and direct his team to improve accordingly. Layers of checks help safeguard and simplify the management of complex infrastructure.
One you have established the check types you need it’s time to start comparing the nice-to-have features to make your life a little easier. There is a great deal of differentiation here, as some providers serve up a status page or integrations as “premium” offerings.
Visibility matters. Who can see it? Will executives understand it? Does the public have access? During an outage, DevOps is likely to be under pressure internally and through users, so there is value to visible reporting.
Support does not work for free. Every support ticket, even with a macro/quick response, requires time. Someone has to field the ticket, stop working on another task, and respond to it. Increase your user base by hundreds of thousands or millions of users, and support can lose entire days of productivity, sending the same boilerplate response to questions about whether it’s up or down. Visible reporting creates a platform to answer questions and reduce the strain on support response.
The secondary benefit is messaging because the wrong news story can destroy your reputation. When you are in front of the disaster, focusing on transparency, you become the news source. That is infinitely better than being at the mercy of an industry driven by click-through controversies.
Everything from monitoring and reporting looks great. What about the cost of setup? Like your support team, your engineers aren’t working for free, either. There is a setup cost to even testing a provider, so take the time to evaluate all of your requirements.
Ease of use refers to anything from account setup to onboarding new users. During your trial, you might be focused on the basics and getting up and running ASAP; project long-term and consider how users will interact with the system.
If you’re switching providers, it’s also helpful to have an import/export function that allows you to easily transfer hundreds of checks.
Single sign-on software (SSO) is a good example, offering a degree of security to your company and making it easier for your users to adopt. Support documentation and general use can help clue you into the software’s accessibility. You might consider inviting another user to try setting up some checks or retrieving reports to test how the system works from every perspective.
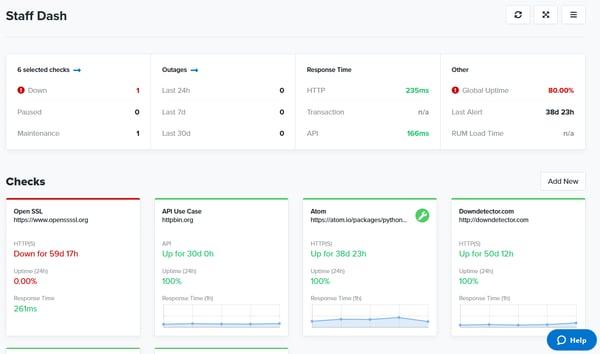
Let’s consider the average enterprise use case, where 100+ monitors are not out of the question. What does reporting look like for this kind of setup? Massive is one word. Convoluted, perhaps another. Over a hundred of anything is going to be difficult to track, so building observability from web monitoring should also take into account what you need to see to do your job. How your provider handles visibility tells you a lot about their primary business.
Some useful features to watch out for include tags, where you can color code or use team or in-house naming conventions to organize checks. You may also have a preference for working in the command line, for which API is an important feature to look. Just be sure to ask about any potential limits you need to be aware of as you consider your options.
One way to approach this issue of volume is to provide a centralized space for check management. If you’re the type who likes that a.m. overview and instant access to key metrics, dashboards give you the visibility you crave. Bonuses here include shareability. Can you or your team design dashboards you can switch to on the fly? Can you control access or assign specific user-specific dashboards?
Most companies value transparency, so status pages are another nice-to-have. Trust doesn’t manifest itself. Coupling your monitoring and status page offers simplicity. If you use a vendor for each of these services, you need to have some layer in between that helps foster communication between the two. Usually, that means someone has to create components meticulously or write a script. Even then, you’re likely pulling data into a self-hosted service, which can run the same outage risks as your website.
A seamless experience between your status page and your website looks professional. However, you need to bake incident management into your response routine, including regular updates to your status page throughout an outage or maintenance window.
Internal status pages are also designed to keep information on a need-to-know basis. People outside your IT team can have visibility on critical downtime. When an outage does occur, internal status pages become a hub for updating the entire company.
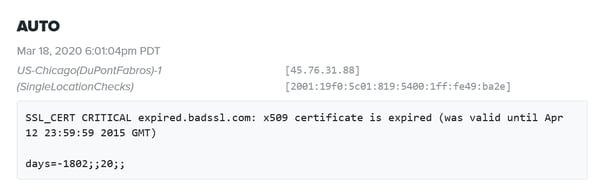
Service level agreements tend to have thresholds built in that signal when it’s time to react to a problem. These “error budgets” allow your team to sleep at night. Alerts and their contents make the difference between a five- and 60-minute response time.
Good alerting is instructive. Alerts might contain status codes, suggested fixes, or direct you to useful resources like alert analysis. The best alerts signify a real problem is occurring and tell you what that problem might be. “It’s down” versus “It’s reporting a 500 error” point to very different issues.
Too vague, and DevOps is likely to lose hair looking for the problem, but being too specific is rarely an issue. Test alert systems thoroughly. If you plan to change providers, run a game-day exercise using the alert system. What information is provided to your team? Did the alert help with your diagnosis?
If you plan for multiple outages, either as gameday exercises or extended tests, you can learn a lot about how your monitoring system works. Do alerts escalate? What about maintenance windows instead of outages? Can your system differentiate?
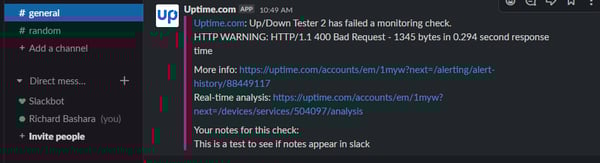
Let’s circle back to our Edgecom use case. James is monitoring his service when he gets a ping in his Slack channel. An HTTP(S) outage signals his blog is down. James is able to tag the person responsible for the blog, who quickly investigates the incident. It turns out an unusual number of page loads is the cause.
The team is wondering if a recent post went viral. James senses an impending attack and scales servers up to improve capacity. Sure enough, his actions are part of a chain of events that help to repel a DDoS attack aimed at taking down his main site.
The moral here is that alerts delivered to your team can lead to diagnosis and unexpected serendipity. No alerts mean pain. Horrible pain.
Do not overlook the value of alert history. Experienced DevOps users likely have a supernatural sense of disaster. They hone that sense by watching for and documenting the causes of disaster.
Let’s say that James is no longer DevOps Spider-Man, and his preternatural senses aren’t quite up to snuff. The DDoS attack does bring down some services. What can a monitoring provider do to help?
Escalations and maintenance are a good start. If your provider allows for it, maintenance windows can provide flexibility to respond to outages while alerting users. Whether maintenance does or does not factor into your SLA, it’s helpful when you can schedule routine maintenance windows and push updates to your power users.
You also waste less time shuffling responsibility and escalating internally if you map out your limits beforehand. How long is it for an outage? Escalating after the five or ten-minute mark is a good place to start, as longer outages signify something is really wrong. Alert systems that automate escalations remove that guesswork, allowing your team to work without worrying about when to notify the higher tiers.
Stop relying on user reports from paying beta testers (your customers), and capture the user experience firsthand. Real user monitoring typically requires some code, like a tracking pixel, but the payoff is actual user data from real sessions. If you have ever wondered what your user is seeing, RUM monitoring is a useful addition to your toolkit.
Synthetic monitoring comes in two flavors, typically API and Transaction. Transaction checks are exactly what they sound like. They test goal funnels and provide first-response capabilities for critical transactions. Be the first to know about problems with your shopping cart, signup forms, logins, and more.
API checks are useful for examining the endpoints that drive the automation side of your service. Most providers allow you to GET, PUSH, PULL, PATCH, or DELETE, allowing an array of possibilities for endpoint monitoring. Bonus points if you can set and retrieve variables.
It’s 2 a.m., and your web monitoring is firing alerts off left and right. You need help! You need analysis and explanations. Responsive support from your provider proves its worth when you encounter an error you either can’t see or can’t replicate.
When you need help, it’s important that there is a team willing to work with you. Early support interactions are a good indication of the quality of service. How long does it take for agents to respond to a ticket? What is the quality of their response, and what documentation can they provide? What support types are available, such as phone or chat support? When a provider hides the contact button, that could be a red flag.
Documentation should be thorough, include examples, and provide step-by-step instructions. If your provider uses code in their documentation, it’s a good sign they know what they are talking about and take it seriously. Bonus points are available for providers who develop outside toolsets, browser extensions, and more to assist in creating your monitoring system.
Monitoring and Reporting are the most important components in deciding on your provider, but the nice-to-have feature list can simplify your work and improve oversight. Remember, the point of an alert is the first response. If your alert is lost in the ether and no one can claim it, did the fire really happen?
Web monitoring software is part of an important commitment you make to your customer base. It says you care about providing a service and that your users can trust you to be there for them. Taking that commitment seriously means reflecting on which of these requirements is most relevant to your organization.
To ensure you're using the best tools to maintain your online presence, explore Top Free Website Monitoring Software.

With the advent of the internet, cloud computing, and virtual resources, it’s no longer a...
 by Dibyani Das

The best VPS hosting providers in 2026 include DigitalOcean, ScalaHosting, Cloudways, GoDaddy,...
 by Hasitha Varre

Choosing a hosting plan is one of the first steps in building a website. The type of hosting...
 by Sagar Joshi