January 22, 2020
 by Evelin Rácz / January 22, 2020
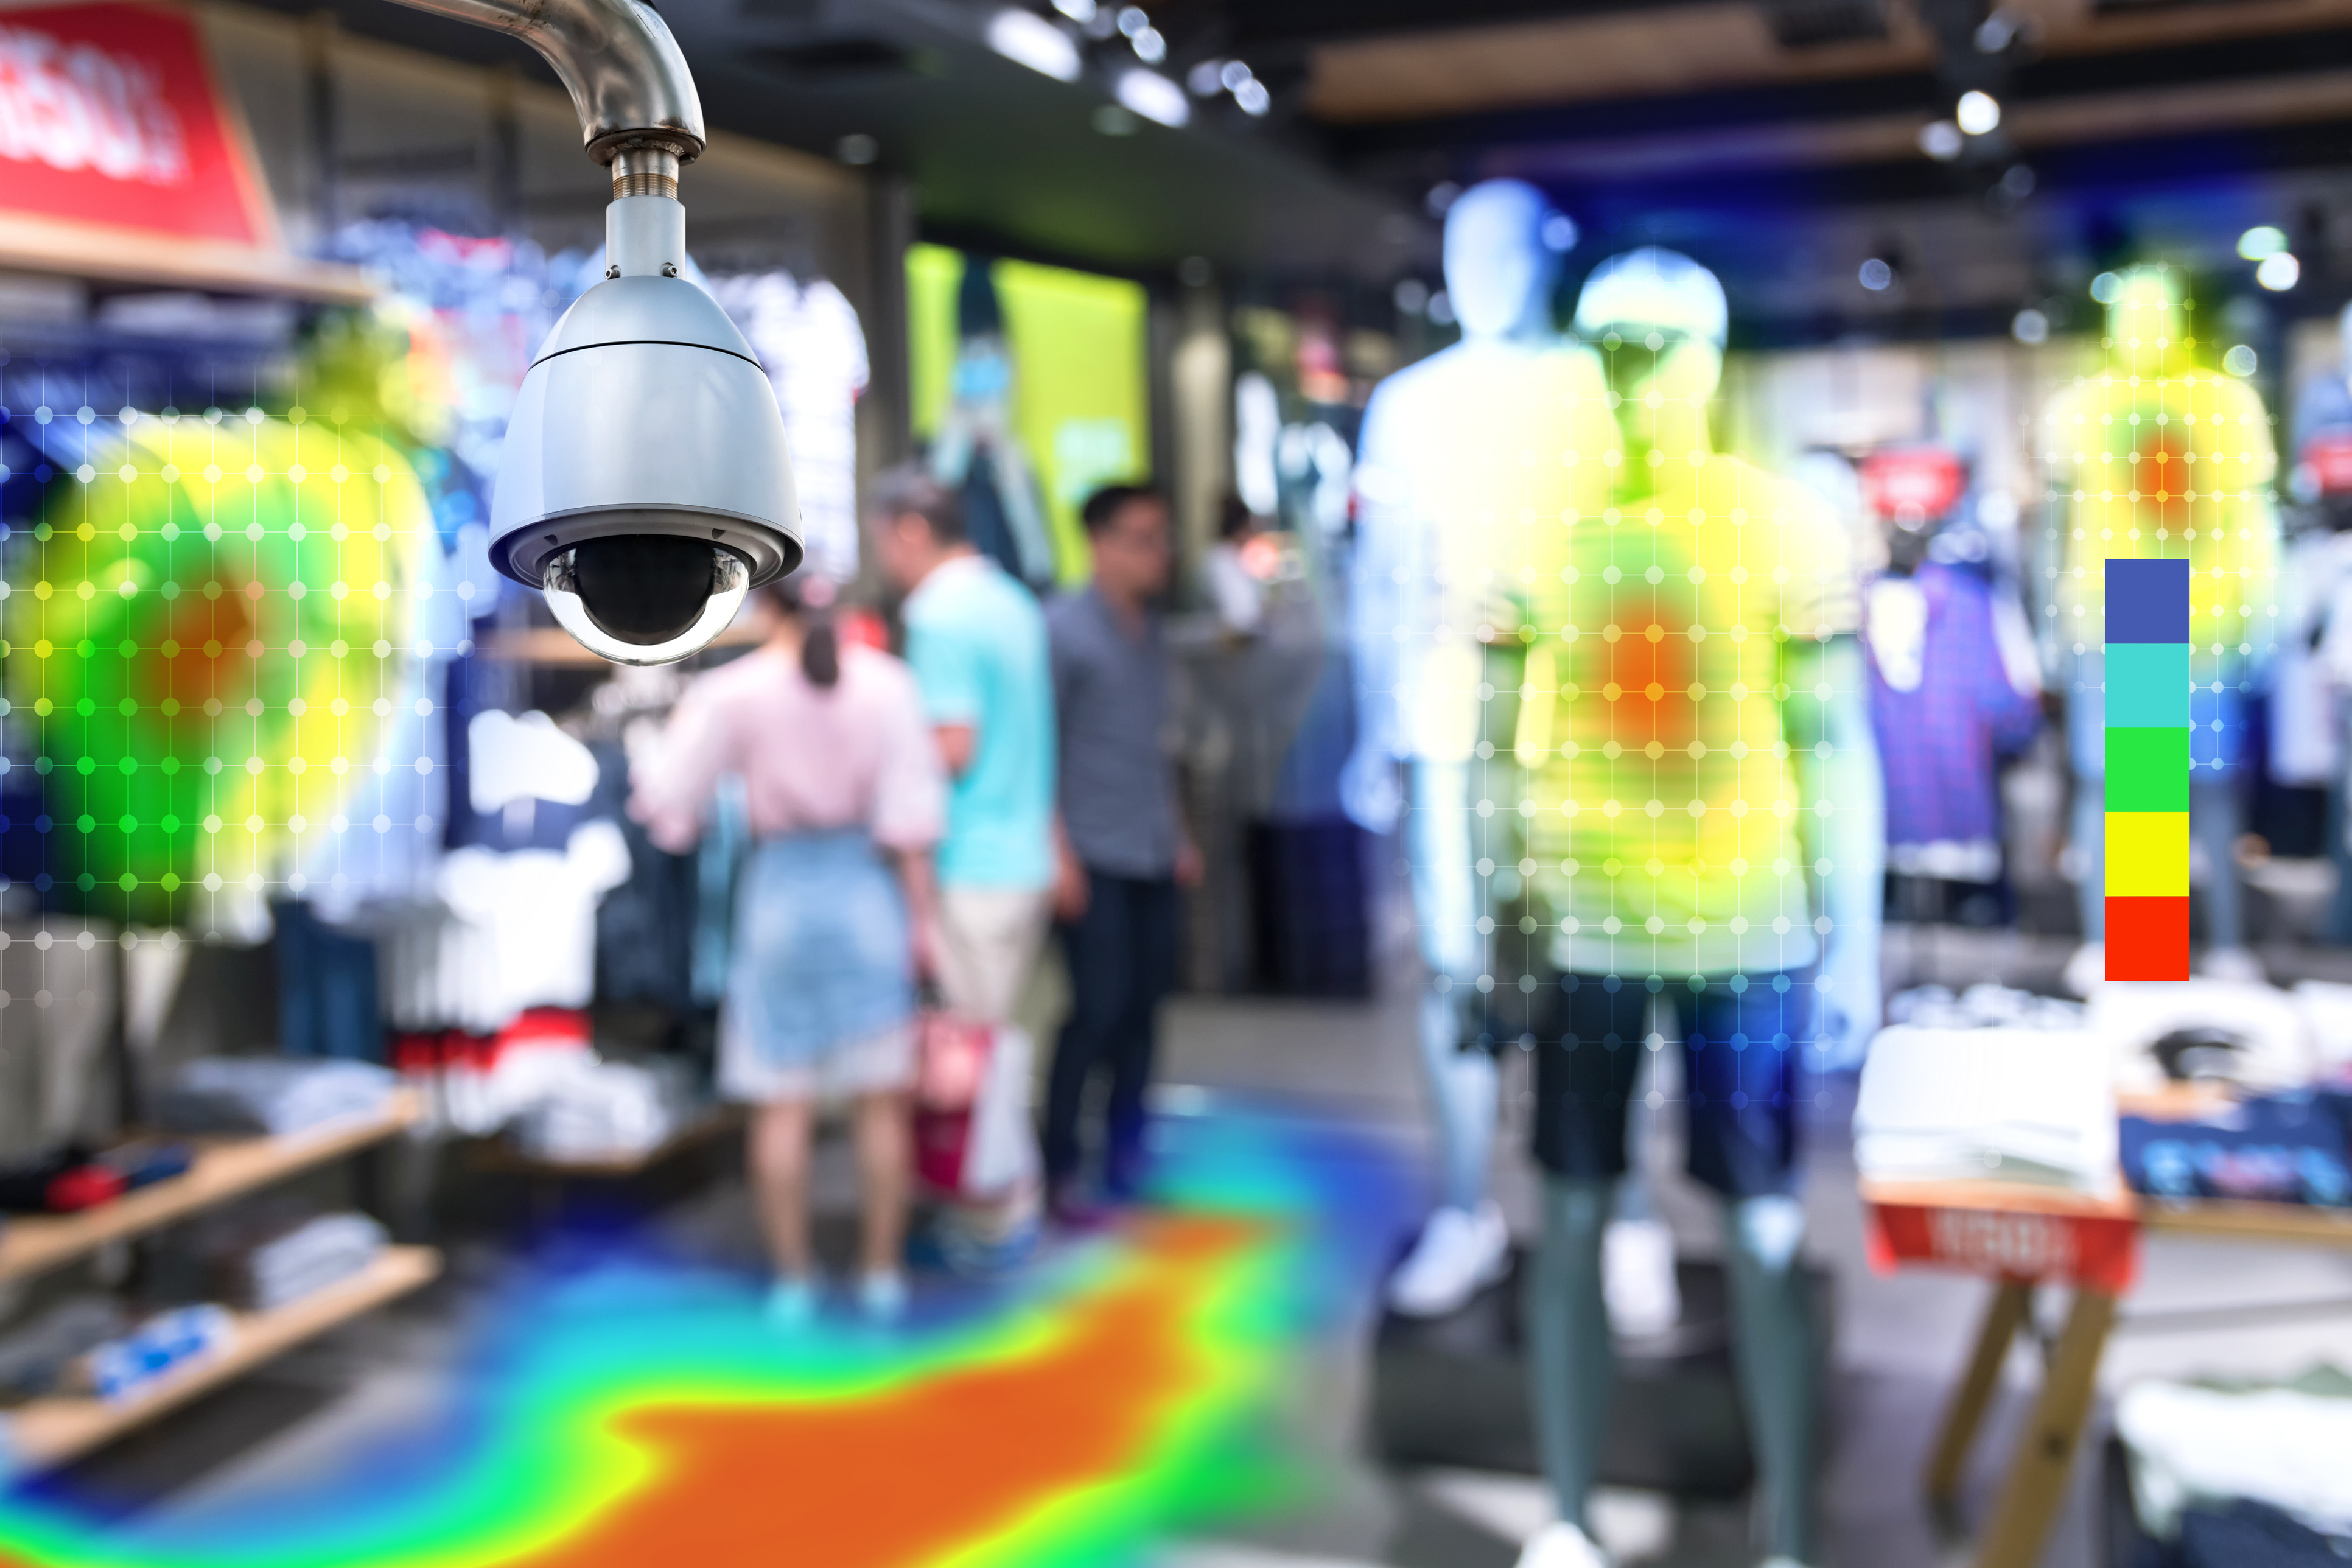
Heatmaps are very helpful tools that can be used for increasing the conversion rates on your webpage while also keeping your site as optimized as possible.
Knowing how they work and what they bring to the table is essential for maximizing the capabilities of heatmaps and getting the most out of them. While it's not hard to read them and use them once you get the hang of it, it is all about the long term with heatmaps. They are one of the best tools that help you understand your users and optimize your site with the user in mind.
Understanding how website heatmaps work and what they tell you is essential for any designer out there. Here, we will take a look at what a heatmap can tell you about your product page.
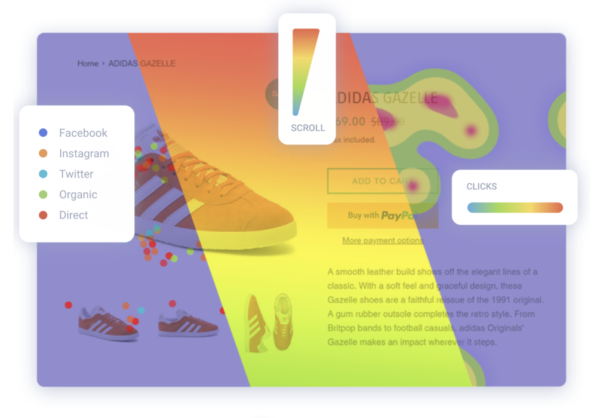
There are more types of heatmaps a designer can use; we will cover them later on and dive deeper on various benefits of certain types of heatmaps. For now, let’s take a look at the basics of heatmaps: what they are and what they are designed to do.
For starters, let's take a look at what heatmaps are. They are conversion rate optimization tools that help developers get to know their customers better. They are essentially visual representations of data that show the designer how the users behave on the website and how they use it. It was first introduced in the 1990s for traders, but it has spread since and has become one of the most invaluable CRO tools out there.
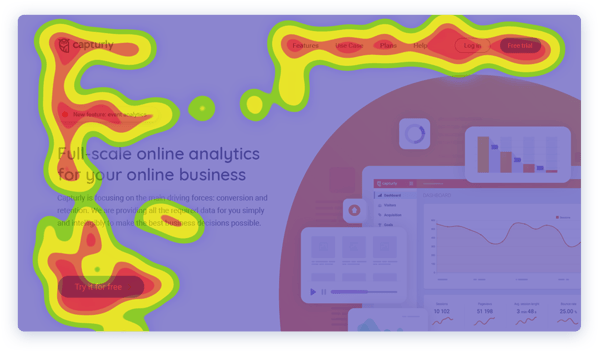
Depending on the type of heatmaps, they tend to show where the users point their mouse most often and how their mouse moves while they use the website. They show you how the users behave on your site, which parts of your site are poorly optimized, where you need to improve it and also what the most popular content on your site is. So heatmaps are website analytics tools that are capable of handling qualitative data.
There are more subtypes of heatmaps that you can use:
Click maps are hovermaps that show you where most of the users’ clicks are made; in fact, it shows every click that users make, be it on your buttons or other elements on your site. Clicking is a powerful indicator of interest. It shows you which elements are popular with users and it also allows you to optimize those elements if they are not working properly. It helps you to find out which elements of your website are the most popular, what should be clickable and what shouldn’t.
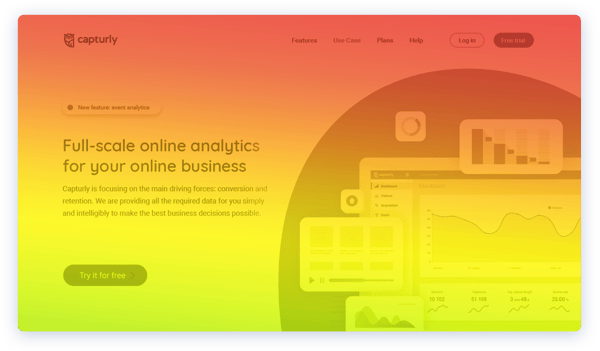
There is a type called scroll heatmap. These are heatmaps that show you how far down your site users tend to scroll. They allow you to position your text, images and other content in appropriate spots (depending on how popular or viewed you want them to be). It shows you where you should put your main call-to-actions on mobile and desktop to catch the most attention.
This type of heatmap allows you to filter data in a convenient way. You can select the data you're interested in by checking or unchecking the right segments. Identify the most popular areas of your page. See if any of the segments are behaving differently than the others. Every segment has its own color for easy distinction. Check the source of the traffic in maximum detail. With segment heatmap, you can focus on a specific operating system, device, browser, or webpage and gather first-hand information about your visitors.
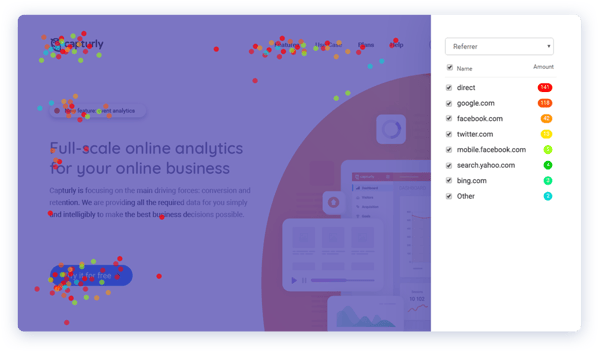
Now let’s focus on the practical side of things with heatmaps, what are they made for and what can they bring to every designer out there. There are many benefits that heatmaps can bring to you, especially if you use all three types in combination.
Here are the best benefits of heatmaps and what they can tell you about your website:
|
This can be achieved by both scroll maps and click maps. Scroll maps are actually very useful because they tell you how far down your site users tend to scroll. It is an important thing to learn because it will help you to position your content in such a way that it will be accessible to anyone and that it will not be placed in such a way where users don’t scroll.
It is actually a fact that most of the users don’t even scroll below the fold; the numbers are largely in favor of those who don’t scroll below the fold. Only about 20% of the users tend to scroll below the fold, while most of them stay above it. That is why it might be a good idea to place your important content above the fold in order for many users to see it.
Another important thing to know about your site is to determine whether your buttons work properly and even if they are placed in the right positions for the users to notice them. This can be achieved by looking at a click map, or even a segment map. If you have a product page, it is even more important to have buttons and call-to-action elements that are working and that catches the eye of the users.
Here is an example of a CTA button:

A click map can be very useful with this; click maps show you where most of the clicks are made from the users. This can tell you whether your buttons are getting enough attention from users. If not, then you should consider placing them in a better spot where the users would notice them. Another thing that click maps can help you with is whether your buttons are working properly; a high click rate can indicate frustration clicks, meaning that your button or element is not working as well as it should and that you should do something about it.
Whether one of your elements is not getting the success you hoped it would, you can incorporate some changes and then perform A/B tests on your site to see whether the changes worked well.
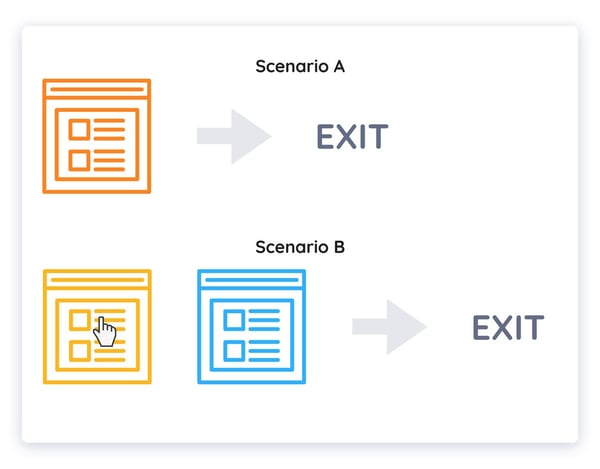
Heatmaps are very useful for determining the success rates of the tests you performed on your site. If they are not successful, you can always revert the changes and use something different again. It's a very nice feature of heatmaps that you can definitely use to your advantage.
Getting your ideas and messages across to the users of your website is essential for providing a quality experience on your site and to bring you more success. Fortunately, you can gauge whether the content you wanted to stick out is actually sticking out; heatmaps can tell you all about this. If your content is not generating enough interest or at least not as much as you hoped for, then it is time to change something.
You can try doing various things, such as placing that content onto another part of the website, or portray it slightly differently – maybe change the colors or the font if you want the text to stick out more. An important feature of heatmaps is the fact that they tell you whether the content you deem important is getting enough attention from your viewers.
With product pages, images are absolutely essential for promoting your product effectively and in an appealing way. A good image can really make your users like the product more. On the other hand, a bad image can ruin the whole image of the product and make it obsolete. Humans are visual creatures, which means that they tend to focus more on visual things rather than more concrete things.
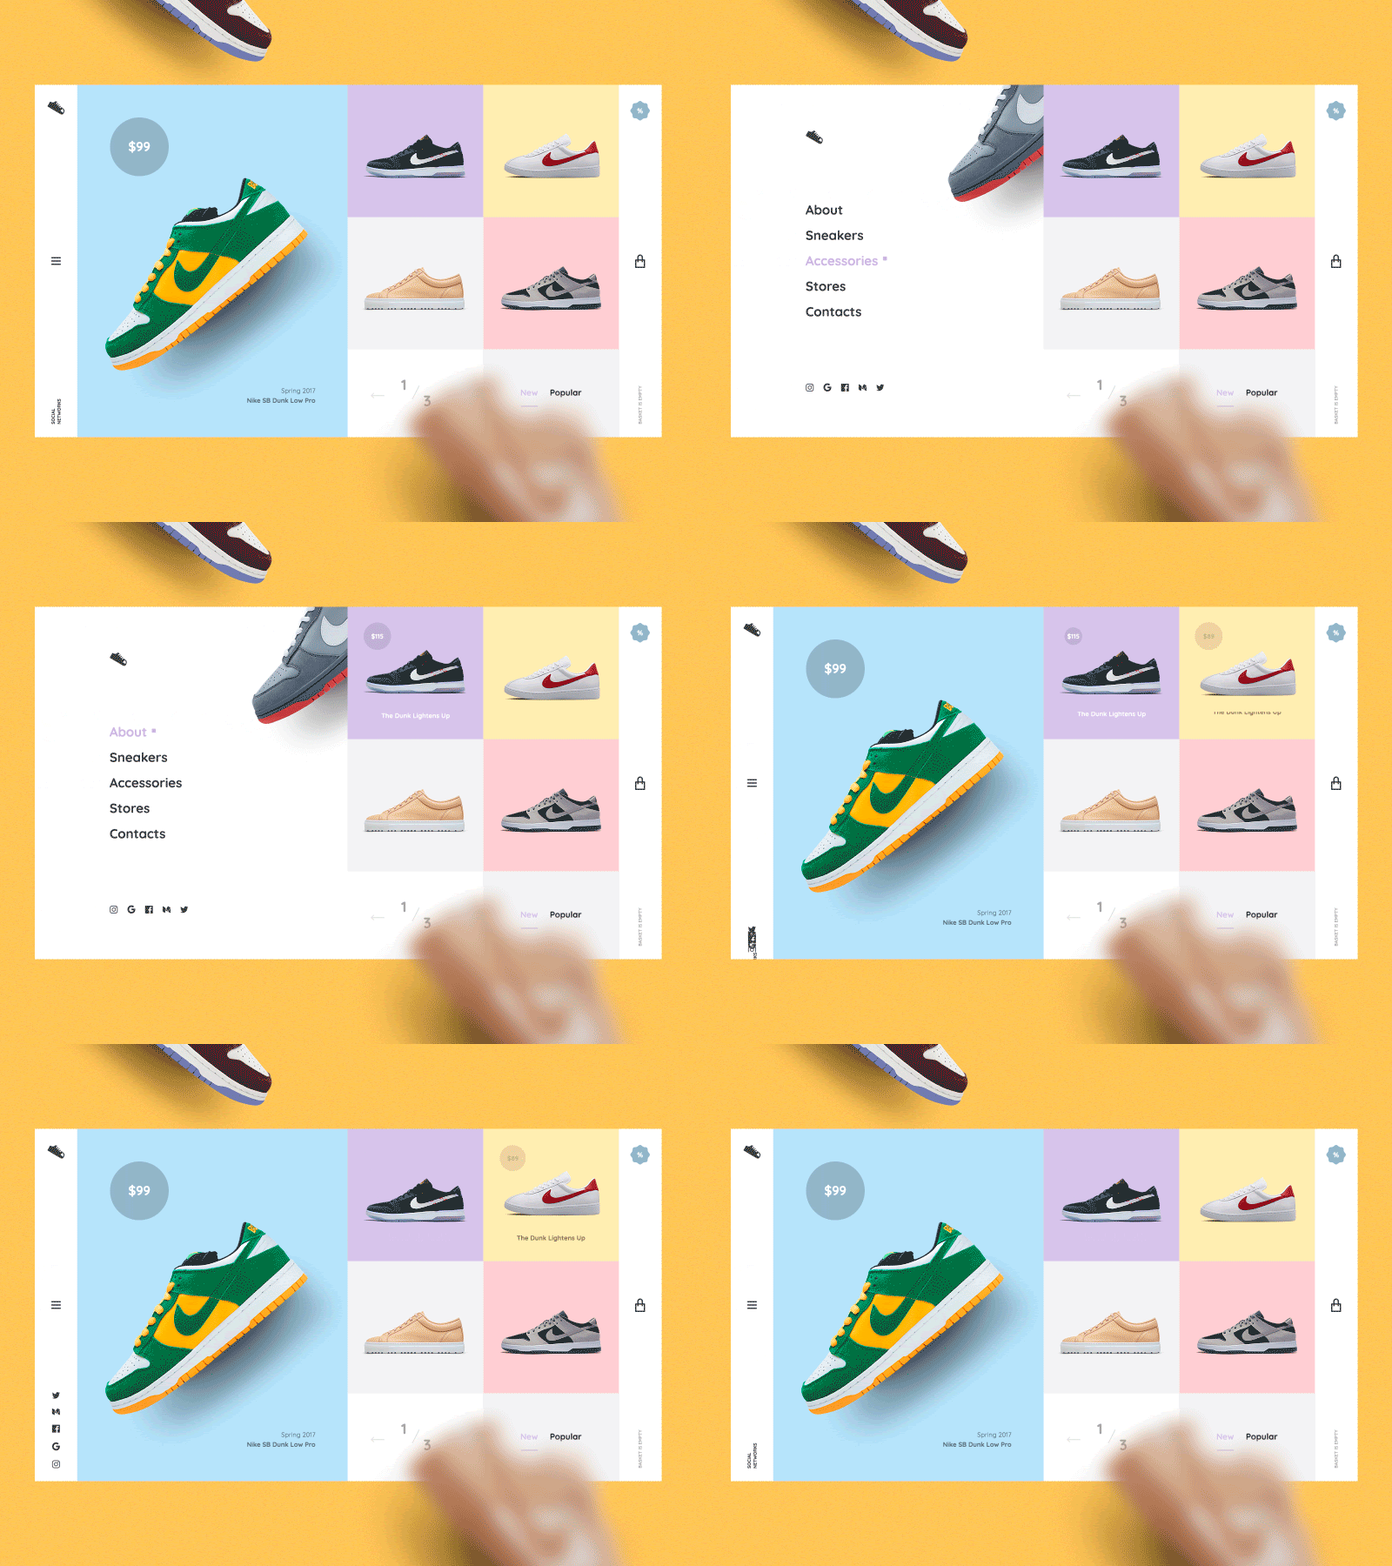
You can interpret the success of your images with heatmaps. These tell you whether your images are getting enough attention and whether they are of high enough quality to satisfy the needs of your users. Great images, in addition to good product descriptions and well-positioned content are what makes a good product page that will certainly appeal to your visitors.
Heatmaps are absolutely essential tools for every designer out there that wants to create an appealing product page that will attract users and help them to sell as many items as possible. There are many things that you can learn from heatmaps, and they let you customize your site in such a way that it is designed with the users in mind.
There are three types of heatmaps: click heatmaps, segment heatmaps and scroll heatmaps. Each of them can play a unique role in finding out what strong and weak points of your product page design is. Heatmaps allow you to find out whether your content is properly placed within the website; they also help you determine the quality of your buttons and call-to-action elements as well as images, and they also tell you whether your images and the content is good enough to attract users.
To maximize the profits and minimize the amount of failed conversions, it might be a great idea to use heatmaps and reap the benefits that they bring. In the long term, they will certainly benefit you massively in many ways; pair those tips with good content and good products, and you are in for success.
See what other conversion rate optimization (CRO) software can do for you to help you get started with heatmapping for your business needs.
Evelin Rácz is the Content Marketing Manager of Capturly, a full-scale online analytics tool which can provide online businesses with first-hand feedback and real business insights simply and intelligibly.
PHP and Python help companies build various digital products. Choosing the right one depends...
 by Sagar Joshi
It just might be the holy grail of programming languages.
 by Bridget Poetker
Everyone who is now an expert in their field had to start somewhere. And that somewhere is the...
 by Mara Calvello
PHP and Python help companies build various digital products. Choosing the right one depends...
 by Sagar Joshi
It just might be the holy grail of programming languages.
 by Bridget Poetker


