

Backlinking is a tried and tested way of boosting your SEO rankings.
However, if your regular guest post pitches aren’t getting much traction, you might want to switch things up and try your hand at guestographics. The guestographic is basically a linkable asset with infographics used in a new way.
Entering into the world of link building might be daunting, as other brands might have gone far. You can beat the race and practice ethical SEO and link outreach through SEO tools with link-building capabilities so that you never get flagged by the Google search response algorithm.
Don’t worry if you’re confused about how to make the perfect guestographic that gets accepted every time. We’ve compiled an extensive guide to help you with just that, from creating your own infographic to finally pitching it to the right sites.
Guestographics is a combination of infographics and guest posting. Using affordable and appealing design protocols, users can put together an infographic and soft-sell it to another reputable domain in exchange for a contextual backlink. Backlinks earned with guestographics are highly authoritative and get crawled faster by Google search bots.
In 2016, Brain Dean of Backlinko coined the phrase “guestographics”. He described them as a cross between a guest post and an infographic. So you create infographics, post them on your site, find high-ranking sites that write on topics similar to your infographic, and pitch it to them.
In his latest blog post, he explains the value of pitching the infographic to prospects with a "nugget" of valuable content. He terms it as an "ethical bribe" where you also offer to write an itsy bitsy guest post in exchange for an infographic backlink. Think of it as a guest post outreach campaign where you're eliciting them to add your infographic on their site with a small content doubler and a great backlink to your original blog.
Dean argues that guest posts that add greater value to a blog have a higher chance of getting accepted. Nothing adds more value in today’s fast-paced world than visual content. People want to see all the relevant information presented in front of them, so they don’t have to dive deep to find it.
If you believe in the quality of the visual infographics to advertising, begging for a link wouldn't seem so seo-like. Visual information is also easier to recall, meaning it will stay with your readers longer. And infographics are visual, easy to absorb, and shareable, thereby adding far more value than reading the same thing in a blog. Put all these benefits together, and the conclusion is clear: guestographics are bound to do better than regular guest post pitches.
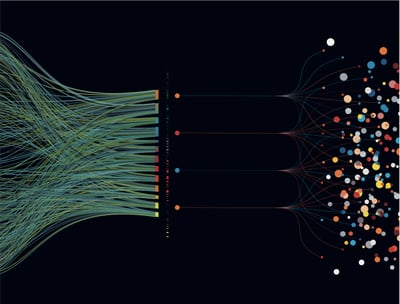
Dean even provides tangible proof of the guestographic method. The organic traffic to his page increased a staggering 175.59% compared to the previous month. Take a look at the massive increase in referring domains pointing to the page:
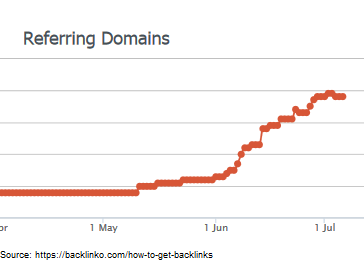
Clearly, Guestographics has huge potential – and they work.
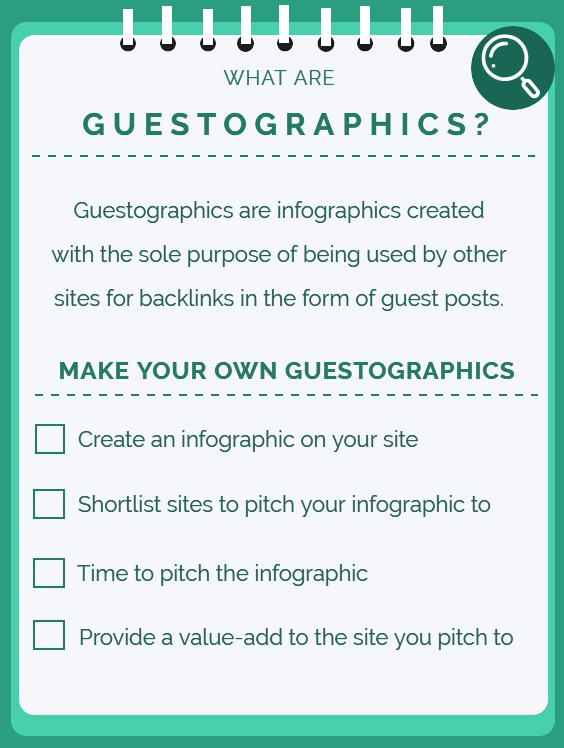
Link building through guestographics might sound like a daunting task, but it isn’t once you get the hang of it. We’ve broken down the process into four key parts that you have to follow in order to create and finally pitch your infographic to the right websites.
There’s also a little checklist that you can easily refer back to whenever you’re implementing the guestographic method for yourself.
Before you start creating your infographic, come up with a topic, something fresh and relevant that people want to link back to. Research the latest trends in your niche, visit forums to figure out what people are talking about, or look at what your competitors are doing and then do it better.
To brainstorm ideas about what your audience is looking for, try to understand them. A good way to do that is to ask exploratory questions about their past and present experiences so you can create better-targeted infographics they can relate to.
Once you have the topic ready, you want to think about what goes on the infographic and what doesn’t. According to Infographics: The Power of Visual Storytelling, a successful infographic can be something as simple as a road sign of a man with a shovel that lets you know there is construction ahead. So don’t try to overload your graphic with tons of data, but don’t shy away from creating complex data visualizations either. As long as what you’re creating is relevant, original, creative, and easy to understand, you’re good to go!
We’ve talked a bit about the content, but don’t forget the other important element of any good infographic: the design! Your graphic has to look informative, not just be. When it comes to the design part of the infographic, you also have to choose between creating an animated or video infographic. Let’s look deeper into how to create both.
If you don’t have a lot of time and resources to set aside for video infographics, then worry not because animated infographics can do wonders for you as well. Besides, they’re much easier to produce while being just as effective.
Look at an impressive example of animated infographics sourced by G2. See what I did there? No courtesy, no semi-automatic mentions. But a credible mention that helps earn backlinks.
/animated%20infographic%20example%201-1.webp?width=600&height=640&name=animated%20infographic%20example%201-1.webp)
Let's break down the properties of animated infographics:
In research carried out by WordStream, 59% of executives agreed that they would much rather watch a video on a topic instead of reading about it. For a content creator, it’s time to incorporate more video elements into everything, including your guestographics. Video infographics are still considered unique since not a lot of websites are using them. This is why the chances of your guestographics being accepted skyrocket if you produce video infographics.
You’ll find that creating a video infographic gives you more room for creativity. It’s easier to grasp the viewer’s attention through videos by telling a story and evoking certain emotions. Just don’t forget to keep your video infographics short and sweet and end with a call to action.
Now that you have your infographic ready, it’s time to find sites that might be interested in it. You’ll have to look for websites that write about similar topics and have an active audience that will benefit from your guestographic.
The simplest way is to Google keywords related to your graphic. For example, if your guestographic is about Gluten-Free Recipes, you want to search for that term and variations such as “Gluten-free baking” and “Gluten-free ideas.” The search results will pull up blogs that focus on such topics and might benefit from the added visual. Those search results give you a list of all the possible sites that you can pitch your guestographic to.
Another way is to reach out to your previous collaborators through your established outreach database. Check your inbox for unanswered follow-ups, or go to LinkedIn to find top marketing academia interested in building infographic links.
Now that you have your guestographic and list of potentials ready, it’s time to email them. Create an email template that works for you, and then stick to it. Of course, you’ll need to add personal touches to each email, such as changing the name and maybe writing a little about their website.
Here’s a simple template that was built by backlink manager that you can pick up and customize for yourself, too:
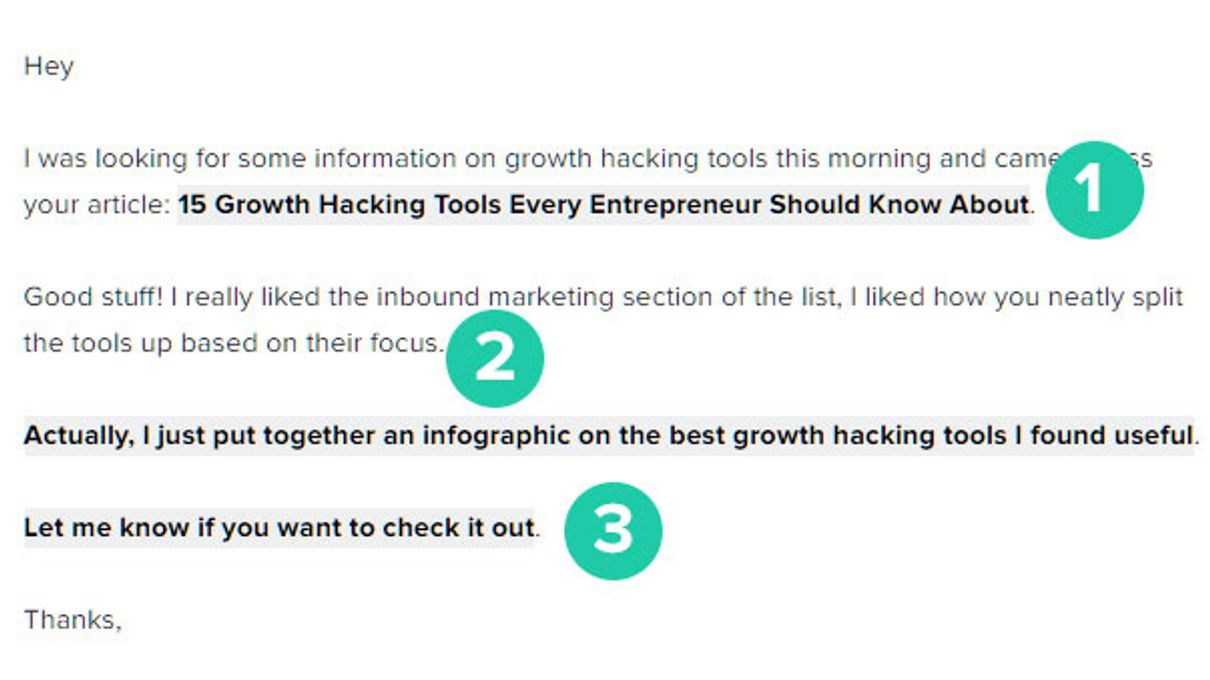
Here’s why this template or similar ones work:
You’ve sent out your first batch of pitches that include a soft sell. Now it’s time to think about how you’re going to respond to the replies you get. At this stage, most people beg sites to link to their infographic. Begging and adding value aren’t the same, and you want to add value to the site, so they want your infographic.
Along with the infographic, you can write the site a mini guest post as well. This way, you’re pitching greater value to them in three ways:
Here’s an email that you can send out to all the people who reply to your first message:
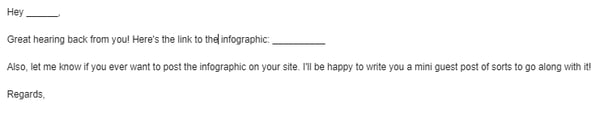
Once the site gives you the go-ahead, tailor the guest post to their site so you’re not writing the same introduction for multiple sites. Furthermore, try keeping it short, somewhere between 250 to 300 words. You don’t want to overshadow the infographic with a whole lot of text on the side.
There are three crucial elements that every good guestographic needs to have: in-depth research, great visuals, and real-life examples. It seems intuitive, right? However, more often than not, people focus on a couple of elements and forget the rest. An infographic might have amazing and super helpful facts, but no one will go through it if the visuals aren’t right, and vice versa.
Neglecting even a single element can make a huge difference to the end result. So let’s dive deeper and discuss all three elements in further detail.
Before all else, you need the content that goes into your graphic. For this, you have two options; you can either do your own original research, or you can pick up information from already published external sources on the internet.
If you have enough resources to do your own research, then that is the route you should take. Chances are you’re going to get more acceptance this way because not only are you pitching an infographic, you’re pitching one with new and original information.
However, don’t worry if you can’t come up with original research. There’s plenty of research available on the internet that people don’t have time to go through, so everyone will benefit if you simply create an infographic out of it.
It’s important to keep your target audience in mind here. Consider questions like Do they want more statistics, or are they looking for simple tips? Knowing this helps you refine your research and makes your job easier.
There are two things you have to consider when visually planning your infographic - the design and the layout. Both of these terms are used interchangeably, but they are vastly different. The layout is how you organize and present the information. For example, you want the most important information to be at the top and for all of it to flow like a story. The design deals with how the information looks, meaning the fonts, colors, icons, and images you choose.
Let’s discuss the design elements further. Ensure that the visuals you choose are in sync with the topic and website you’re pitching to. For example, if the infographic is about business automation processes, then you can’t put emojis in there since those aren’t in sync with the serious topic at hand. Similarly, the visuals need to show what the text is about. If you’re writing about gluten-free recipes, add loads of bread icons so people know you’re talking about gluten without even having to read further.
Be smart about how you want to display your information. If you have loads of labels and stats, you can add charts. If you’re describing a process, add arrows from one point to another. Remember to follow user designing (UX) guidelines like drop shadows, hairline divider placement, and icon structures.
The last element that you certainly don’t want to forget - examples. Any good infographic needs a real-life example to bring it all together. Let’s say your infographic explains how to implement a certain cooking technique. In this case, include a demonstration in your infographic so the viewers know how it’s done. Moreover, your readers need to know what you’re saying is real and true. Giving a real-life example or demonstration helps achieve just that.
Adding an example makes all the information easier to understand and further illustrates the point you’re trying to make. It also decreases the probability of the technique or process being applied wrongly when readers try it for themselves.
We breathe and thrive in the world of data visualization. Brand marketers are hauling opportunities to gain more and more visibility through the smart exchange of infographics. This newer form of marketing has upturned the guest posting process and given SEO marketers a new tinge of hope. With guestographics, you can take the helm of large-scale content projects and scale them effortlessly.
Stuck in a sea of million outreach emails with no response? Learn how to crowdsource answers by connecting to reliable subject matter experts through HARO.


If you think about it, visual content is the secret ingredient in transforming text-based...
 by Kai Tomboc

Facebook retargeting isn't exactly new to the paid social advertising world.
 by Sean Thomas Martin
You’ve compiled some boring information and you have to present it Friday morning. How can you...
 by Daniella Alscher