
There's much debate in the sales industry over which sales key performance indicators (KPIs) and metrics matter most. One size definitely does not fit all.
This is the case for a good reason - every business prioritizes metrics that measure and reflect their primary goals and objectives for that time period.
If a business is concerned with revenue, its sales KPIs will reflect monetary metrics. If another company wants to grow a solid customer base, its KPIs will revolve more around measurements like customer retention and brand recognition.
No matter what progress and goals you're tracking, objectives and key results (OKR) software can help.
What are KPIs in sales?
A sales KPI is a metric that measures a sales team's effectiveness and tracks progress toward the organization's goals. It includes data on lead generation, conversion rates, and overall performance to help optimize strategies and enhance business outcomes.
Whether your business is currently focusing on revenue, growth, or customer retention, it’s wise to analyze primary objectives before looking at the nitty-gritty activities that support them—meaning KPIs are a good place to start.
The following 14 key sales KPIs are important for any sales manager to measure at some point -- the fundamental word being “key.” A sales manager will keep track of plenty of other metrics to evaluate their team’s efficiency. The following KPIs simply give an overview of the team’s general performance.
Sales metrics vs sales KPIs
Sales KPIs are specific sales metrics that measure performance against strategic goals. Unlike general sales metrics, KPIs align individual or team activities with overall business objectives.
When measuring any goal, businesses will compare their progress against their goals for that particular time period. It’s important to note that the time periods a sales team uses to measure these KPIs can differ from business to business. Some companies like to evaluate each month, others prefer to wait until the end of the quarter, and some even do both.
Every metric listed below can be measured for an entire team or an individual rep.
1. Total revenue
Revenue is the income that a business generates from normal business activities, usually from selling a solution to customers. In accounting, the terms “sales” and “revenue” are often used interchangeably.
Total revenue combines the income from every business or selling activity the company conducts.
Sometimes, sales managers want to dive deeper into revenue to find the defining variable of any high-performing or struggling area. To do this, managers typically break down revenue based on the following parameters:
- Revenue per product: Is there a certain product that’s performing well? If so, should your reps be dedicating more time to selling it?
- Revenue per territory: Is there a certain sales territory that’s more willing to buy? Should you rework your sales territory management plan?
- Revenue per customer: How much revenue are existing customers contributing? What about new customers?
Measuring revenue provides a good idea of the business’s profitability. As you’ll see with a few other KPIs, cost must always be considered. However, establishing solid revenue streams is an important first step in combating those expenses.
To calculate revenue, you simply total the amount of money your business has made from selling activities in that particular time frame.
Example of measuring revenue
Goal for January revenue: $500,000 in revenue/month
Actual January revenue: $468,000
= 94% to goal
Want to learn more about Business Intelligence Software? Explore Business Intelligence products.
2. Gross profit margin
Gross profit margin reveals the amount of money (revenue) left over from sales after the cost of goods sold is considered. This sales KPI is often expressed as a percentage of sales.
Gross profit margin highlights a business's true profitability and financial health. Revenue can give you an idea of how well the company is performing; however, if a business’s cost of goods sold exceeds revenue, it will not ultimately make a profit.
A company’s gross profit margin also reflects its business model compared to its competitors. Calculating the gross profit margin is important in evaluating the sales team's efficiency in generating revenue from the costs involved in producing their solution. Is their current approach to selling and production working?
An important fact to remember before calculating gross profit margin or setting goals for it is that growth in revenue does not necessarily translate to an increase in profitability.
To calculate gross profit margin, subtract the cost of goods sold from revenue and divide that number by revenue.
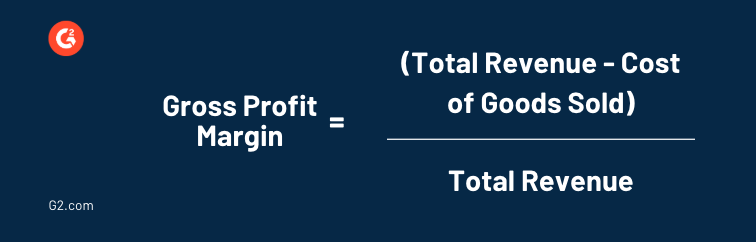
Example of calculating gross profit margin
Goal: 15% gross profit margin
Revenue: $468,000
COGS: $400,000
Actual gross profit margin: 14.5%
= 97% to goal
3. Sales growth
Sales growth compares the increase or decrease in revenue of two different time periods. This sales KPI is often expressed as a percentage, and goals can be set personally or across the whole team.
Tracking the sales team's growth, either monthly or quarterly, relates to the overall growth of the business. If you are generating more revenue and retaining repeat customers, the business can grow in other areas (hiring, expanding, etc.).
Measuring sales growth will reveal whether or not your current selling strategy is working.
For example, if you switch your focus from cold calling to emailing prospects and see an increase in growth, the sales emails might be more effective when selling your solution. With that, make sure you aren’t switching up too many different parts of your strategy. If a lot changes and you see a change in growth, you won’t know exactly what caused it.
Another thing to keep in mind when measuring sales growth is the company's experience. If you compare your second and third months in business, the growth percentage is (hopefully) going to look a lot different than your 61st and 62nd months.
To calculate sales growth, subtract the past period’s revenue from the current period’s revenue and divide that number by the past period’s revenue.
Some businesses will do this month-to-month or quarter-to-quarter. Others will compare the same time period from different years. For example, a business might compare January 2024 with January 2025 to see how the company has grown within that year.

Example of calculating sales growth
Goal: 15% growth
Past revenue: $400,000
Present revenue: $450,000
Actual sales growth: 12.5% growth
= 83% to goal
4. Lead to opportunity ratio
A lead is a person or business that has expressed an interest in your company, and an opportunity is a lead that has been qualified as worth pursuing by your sales team.
Your lead-to-opportunity ratio uncovers how many of your leads are being converted into opportunities by comparing the number of customers currently sitting at those two spots.
Your business’ lead-to-opportion ratio uncovers how many leads you need to generate to stay on track to hit your goals. Once you find your baseline ratio for how many leads convert to opportunities, you will know how many leads you need to hit goals and eventually see sales growth.
If your lead-to-opportunity ratio is struggling, you’ll want to evaluate your sales team’s lead qualification process. Many businesses use the BANT framework, which stands for budget, authority, need, and time.
Make sure you are asking yourself the following questions when speaking with a lead in hopes of converting them into an opportunity:
- Does this business have the budget to buy the solution?
- Does the person I’m speaking to have the authority to make buying decisions?
- Does this business actually need a solution?
- Will this business be able to make a timely purchase?
The lead-to-opportunity ratio is a type of conversion rate since it involves moving a customer from one stage to the next. Because of this, it is represented as a percentage. Simply compare leads against opportunities as a ratio and then convert it into a percentage to calculate it.
Example of calculating lead to opportunity ratio
Goal: 50% conversion rate
Leads: 100
Opportunities: 45
Actual lead-to-opportunity ratio: 45:100, 45%
= 90% to goal
5. Sales closing ratio
Your sales closing ratio takes the lead-to-opportunity ratio a step further by comparing the number of quotes or proposals sent against the number of closed-won deals.
A closed-won deal is when the end of a deal results in the customer making a purchase.
Measuring each rep's sales closing ratio indicates how well that individual closes accounts. Tracking leads to opportunities, which gives an idea of how the qualifying conversations are going, while the sales closing ratio reveals that rep's ability to give a killer value demonstration, handle objections that a potential customer might have, and close the deal.
Some reps might excel at converting leads to opportunities but tank when trying to sell them the solution. Evaluating where reps perform best (between converting leads to opportunities or converting opportunities to sales) will help you understand where they need help improving.
The sales closing ratio is also represented as a percentage, and calculating it involves comparing opportunities against closed-won deals as a ratio and then converting it into a percentage.
Example of calculating sales closing ratio
Goal: 15%
Opportunities: 45
Closed-won deals: 6
Actual sales closing ratio: 6:45, 13%
= 87% to goal
6. Lead to sale ratio
The lead-to-sale ratio evaluates the entire sales process by finding the number of leads that make it all the way down the pipeline and converting them to sales.
The lead-to-opportunity and sales closing ratios give an idea of how well the rep is performing during those particular stages, but the lead-to-sale ratio reveals their overall performance.
It’s common for sales managers to measure this KPI first and then examine the other two that show performance when moving customers between specific stages.
The lead-to-sale ratio is expressed as a percentage that compares the number of leads to sales within a specific period.
Example of calculating lead-to-sale ratio
Goal: 10%
Leads: 60
Closed-won deals: 5
Actual lead to sale ratio: 8%
= 80% to goal
7. Sales by contact method
The sales-by-contact method KPI is meant to show which form of initial outreach is the most effective in closing deals. Examples of sales contact methods include phone, email, or in-person communication.
The contact method used to reach out to the lead initially is an important step in analyzing your sales process's efficiency and strong points. Did the rep reach out via email? Over the phone? At a networking event? Depending on the rep and solution being sold, some contact methods might be more successful than others.
You also need to factor in the cost of each contact method. While selling in person might yield higher win rates, the cost of traveling to each potential customer adds up.
Whatever you conclude about when each method is the most useful, figuring out what works best for your business is worth the extra step of analysis.
To calculate sales by contact method, you need to analyze each technique individually. For example, if you were measuring closed-won sales by email, you would divide the number of sales you made via email by the number of emails you sent.
Example of calculating sales by contact method
# of sales by email: 8
# of emails sent: 75
= 11% success rate
8. Average sales cycle length
Your sales cycle length is the time between your first contact with a prospect and closing the deal. The total length of all closed deals is then averaged across the number of deals within that time frame.
The general rule of thumb is that the shorter your sales cycle is, the better. Prospects don’t want to spend too long in the sales pipeline, but they also don’t want to be pushed to make a buying decision they aren’t ready for.
Understanding your total sales cycle length gives you a good idea of how quickly your sales reps are moving prospects through the pipeline, but looking at the average length of each stage individually will help you once problems arise.
Some stages in your sales process might take longer than others, but it’s the manager’s responsibility to determine when it’s too much. If a stage is proving hard for reps to push prospects through, stress the importance of this stage and offer guidance. This is especially important when other KPIs, like revenue or sales closing ratio, aren’t where you want them to be.
If you want to dig even deeper, examine where your potential customers are exiting your pipeline. Is it after they are qualified? After the value demonstration? Uncover where problems are arising in your sales cycle, find out why, and take action to fix them.
To calculate the average sales cycle length, add the length of all deals (in days) and then divide that number by the total number of deals.
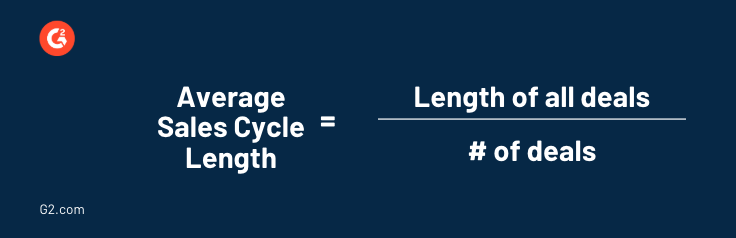
Example of calculating average sales cycle length
Goal: 60 days
Length of all deals: 825 days
# of deals: 13
Actual average sales cycle length: 64 days
= 94% to goal
9. Average revenue per account (ARPA)
Your average revenue per account is the average dollar amount per each closed deal. This number indicates the average customer’s revenue contribution of all your sales.
Calculating ARPA gives sales reps a good idea of revenue generation or sales growth per account acquired. This information is handy when valuing new leads and opportunities.
If a business is spending too much on lead and demand generation, it can gauge whether or not potential new customers are worth pursuing based on the average revenue they contribute.
Sales reps and managers will also use ARPA to forecast goals based on the customers they typically acquire and the growth they see over a certain period.
To calculate average revenue per account, take your total revenue for that time period and divide it by the amount of customers you have.
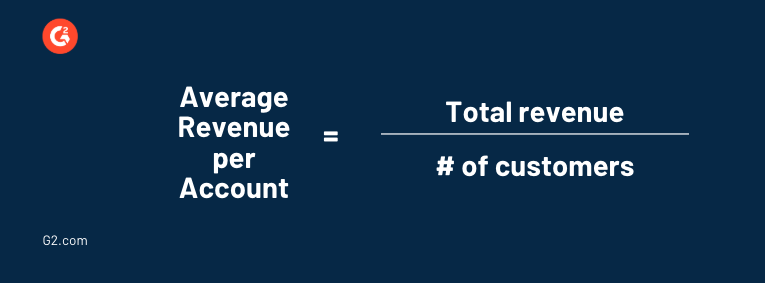
Example of calculating average revenue per account
Goal: $50,000
Total revenue: $1,000,000
# of customers: 25
Actual average revenue per account: $40,000
= 80% to goal
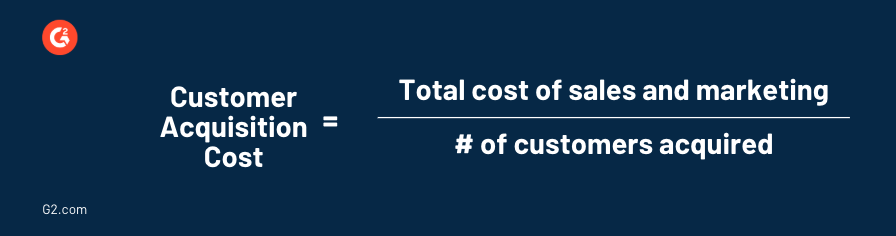
10. Customer acquisition cost (CAC)
Customer acquisition cost is the total cost associated with convincing a customer to buy your solution. This can include marketing, sales rep salary, travel, etc.
As web-based businesses and marketing techniques become the norm, CAC is easier and more important for businesses to track - using highly targeted campaigns to convert a website visitor into a sale does not come cheap.
Customer acquisition cost is compared against customer lifetime value (covered next) to see how long it will take for customer acquisition to pay off, if it pays off at all.
It can be easy to push CAC aside and keep your eyes on the prize: revenue. However, that revenue won’t mean anything if it’s overpowered by acquisition cost.
Customer acquisition cost reflects your business model. If it costs more to acquire customers than they contribute to revenue, your methods for obtaining new customers need to be reworked.
To calculate customer acquisition cost, divide the total cost of all of your sales and marketing efforts by the number of customers acquired.
There is technically no goal regarding customer acquisition cost. Goals for CAC are set when comparing the cost against customer lifetime value, which is covered next.
Example of calculating customer acquisition cost
Total cost of sales and marketing: $750,000
# of customers acquired: 25
Actual CAC: $30,000
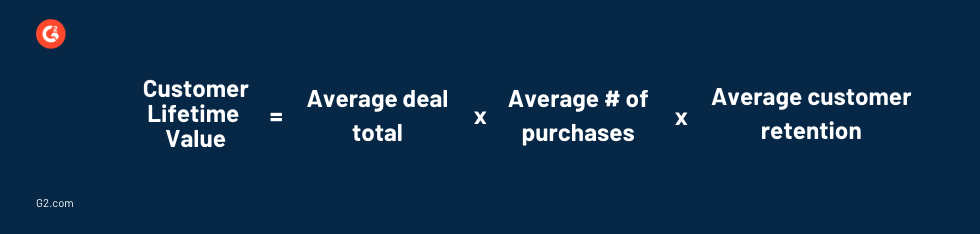
11. Customer lifetime value (CLV)
Customer lifetime value predicts the profit a business will acquire over the course of its relationship with a customer. Essentially, it is the monetary value placed on the relationship with a customer.
Customer lifetime value is similar to average revenue per account, as it gives the sales team an idea of how much the cost and effort of acquiring a customer will pay off. Literally.
However, another reason sales managers stress CLV is to shift sales reps' thinking from focusing on hitting quota and making commission to creating lasting and mutually beneficial relationships with customers. In the end, the latter will be more valuable.
Understanding where a sales team stands with its CLV informs strategies that focus on customer acquisition and retention efforts. Standing alone, CLV might not mean that much to a business, but a lot can be said when it is compared to customer acquisition cost.
To calculate CLV, multiply the average deal total by the number of purchases and then multiply that by your average customer retention.
In the following example of customer lifetime value, the goal will be expressed as a ratio. As stated above, the idea of a “good CLV” can only be gathered once customer acquisition cost is taken into account. The goal ratio below compares CLV to CAC.
Example of calculating customer lifetime value
Goal: 3:1
Average deal total: $50,000
Average # of purchases: 3
Average customer retention: 5 years
Actual CLV: $750,000
Actual CAC: $300,000
= 83% to goal (however, this is still a good CLV: CAC ratio because CLV is still greater than CAC, meaning the business is making a solid profit)
Measuring the monetary value of a relationship is challenging and might seem impossible. However, CRM software can provide all the information you need to calculate an accurate customer lifetime value.
12. Customer retention rate
A business’s customer retention rate is a percentage that represents the number of customers it has retained over a certain time period.
The importance of this sales KPI depends on the industry. B2B companies need a solid customer retention rate to survive, as it directly affects profitability.
Getting customers to buy once is only half the battle. After spending all of that time and resources on customer acquisition, you want them to stick around for a bit.
Your customer retention rate indicates how well your sales reps nurture their relationships with customers. Once someone makes a purchase, consider that the beginning of your relationship, which will be mutually beneficial (if you play your cards right).
Sales reps need to attend to the customer’s needs even after a purchase is made by doing the following:
- Ask for feedback and adjust the approach accordingly
- Offer customer support
- Follow up with personalized information
To calculate your customer retention rate, subtract the number of new customers in a time period from the number of customers at the end of it. Then, divide that number by customers at the start of the time period.
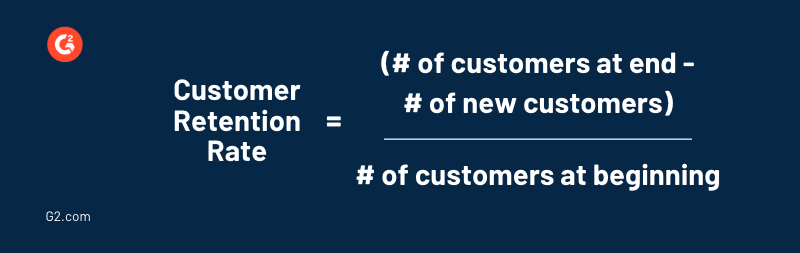
Example of calculating customer retention rate
Goal: 25% retention rate
# of customers at end: 150
# of new customers: 75
# of customers at beginning: 325
Actual customer retention rate: 23%
= 92% to goal
13. Churn rate
Churn rate is the opposite of retention rate. It’s a percentage representing the rate at which your business loses customers.
For a business to expand, its growth rate (in terms of customer base) must exceed its churn rate. A higher churn rate means a smaller customer base, lower revenue streams, and decreased profitability.
Churn rate is a particularly important metric for businesses whose customers pay on a recurring basis, such as those that use a subscription pricing model. If your customers aren’t sticking around long enough to contribute enough revenue to compensate for their acquisition cost, you will end up in the red.
Like retention rate, churn rate indicates how engaged and satisfied customers are with a business after purchasing. If your sales reps aren’t making special efforts to sustain customer relationships with support and additional value propositions, you are at a higher risk of them walking away.
To calculate the churn rate, divide the number of customers you have lost by the number of customers you have acquired in a certain time period.
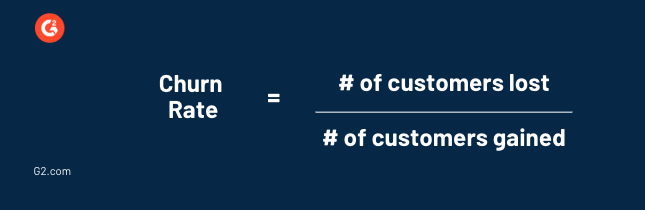
Example of calculating churn rate
Goal: < 15%
# of customers lost: 50
# of customers gained: 500
Actual churn rate: 10%
= 150% to goal!
14. Net promoter score (NPS)
Your business’ net promoter score is an index, ranging from -100 to100, that represents how satisfied your customers are and how likely they are to promote and recommend your solution to others. It is the core measurement of customer experience.
The net promoter score scale is divided into three segments: detractors, passives, and promoters.
Detractors (0-6): Detractors are unhappy customers who can possibly do damage to your brand by spreading their poor experience online or via word of mouth.
Passives (7-8): Passives are happy with the product but not overly enthused about it. They’re customers at risk of switching to one of your competitors.
Promoters (9-10): Promoters are extremely satisfied customers who are loyal and enthusiastic about your solution. They become repeat buyers and also recommend it to others.
This data is often gathered by distributing a survey to customers. You can ask for feedback on the company overall or get more specific and ask customers how they feel about a product or customer service. This way, you can see which areas customers didn’t like and which they found pleasant.
Your net promoter score reveals not only customer satisfaction but also loyalty. Support, customer service, follow-ups, and the sales rep's listening skills can affect customer loyalty.
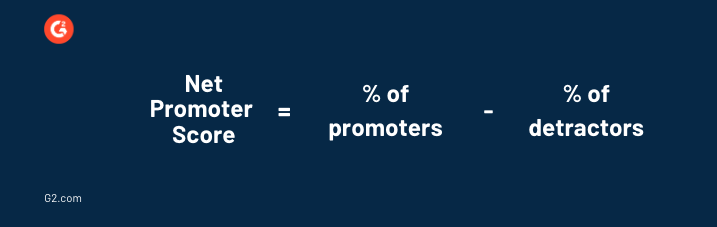
To find your overall net promoter score, subtract the percentage of detractors from the percentage of promoters. The final NPS score is not a percentage but a number between -100 and 100.
Example of calculating NPS
Goal: +5
% of detractor: 25%
% of promoters: 23%
Actual NPS: +2
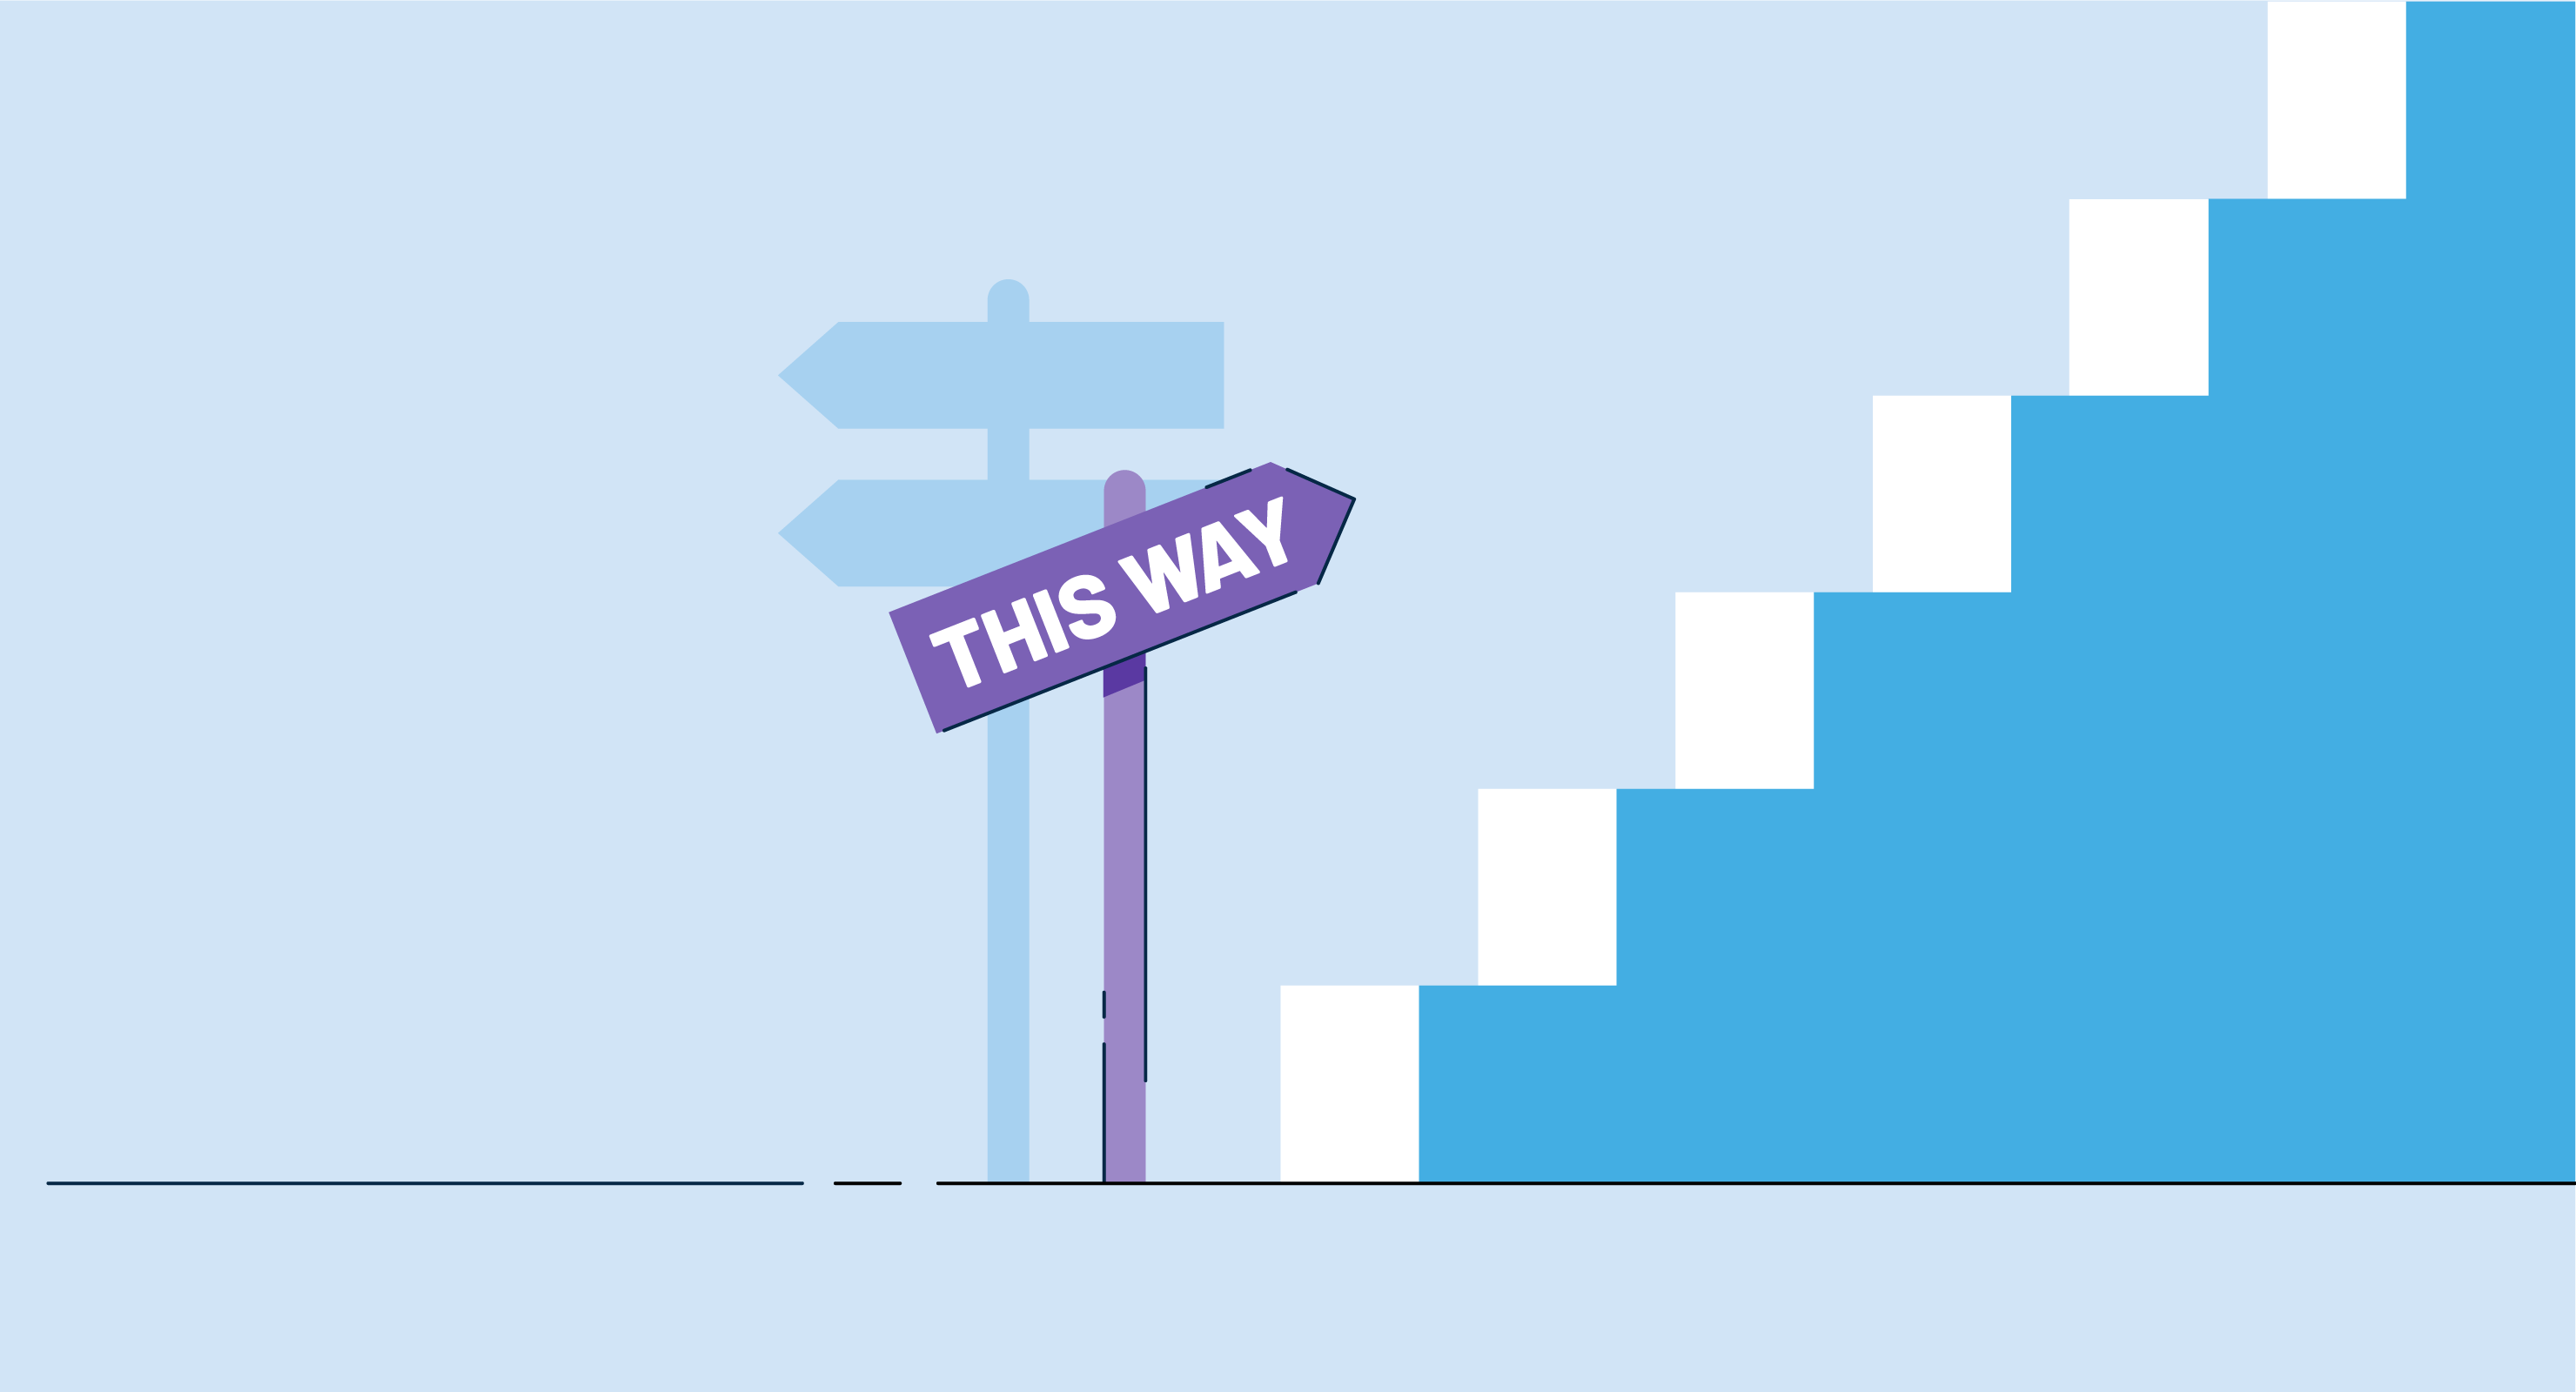
How to choose the right sales KPIs
Lorem ipsum dolor sit amet, consectetur adipiscing elit. In molestie dolor lacinia sem ultrices fringilla. Donec neque ipsum, tincidunt non tristique sed, imperdiet et nisi.
- Choose KPIs that support business objectives.
- Focus on metrics that drive sales success.
- Limit the number of KPIs for clarity.
- Select easily measurable metrics.
- Establish achievable benchmarks.
- Regularly evaluate and update KPIs.
- Involve the sales team in selection.
How do you measure up?
No business is the same, so their key performance indicators shouldn’t be either. Different companies prioritize different goals and objectives, and the way they measure success will reflect those metrics.
Your sales KPIs will change as you learn, grow, and change as a company. However, the 14 listed above are a good place to start.
Did you get lost in all of that sales jargon? Check out our resource on sales terms to learn the most commonly used words and phrases in sales.
This article was originally published in 2020. It has been updated with new information.
Mary Clare Novak
Mary Clare Novak is a former Content Marketing Specialist at G2 based in Burlington, Vermont, where she is explored topics related to sales and customer relationship management. In her free time, you can find her doing a crossword puzzle, listening to cover bands, or eating fish tacos. (she/her/hers)

