There’s no escaping it; it’s all around us.
Every day, across every industry, every company generates a ton of data. This data is powerful. Lessons learned from sales data can be powerful enough to drive a business to success. If we harness the power of all this data, we can refine the finest details of our business and make each process as efficient as possible.
With a vast ocean of results, figures, and data points to decipher, things can get messy; a lot of questions get asked. The following guide aims to answer some of those core questions and expands on some of the specifics of sales data analysis by outlining key data points to follow.
Sales analytics is a crystal ball for your company, a window into the future. To analyze existing sales data is to identify, model, understand, and predict sales trends and results, deriving meaning from them to discover and improve different sales processes and avenues.
In human terms, sales leaders use analytics to decide whether there are enough opportunities for reps to hit their targets, to define which reps are the right fit for your company or not, and to constantly strive for those reps to hit new levels.
There are four steps to a comprehensive sales analysis:
Forward-thinking analyzers run different kinds of analyses together to make the smartest decisions they can for their company.
There is no time limit for recommended frequency of sales analysis. It depends on the nature of your sales, and where your company is at in terms of marketing campaigns and other variables. While setting the parameters of your analysis, it should be agreed how often it will be conducted.
Still, there are a few things to remember when we consider the frequency of sales performance analytics:
More doesn’t necessarily mean better for your company. If you track every move your team makes, you’re all going to feel the analysis paralysis. They’re not going to be empowered to sell more, but are likely to get bogged down in charts and graphs.
The sales team gives you everything you need to succeed: an omni-important cog in the business machine. By using data as the basis for our sales actions, we can always be sure what to do. It gives us the basis for understanding who we are, who we are selling to, what we need to say, and how we need to sell it. Data drives revenue.
Your business can predict the future based on historical data. With an encyclopedia of data at your disposal, goals become much more reasonable; from want-to-achieve, to should-be-achieving. By looking into the past, business leaders can allocate resources efficiently and manage their workforce more efficiently, cut waste, and react to market trends quickly. If sales take a downturn, data gives you the opportunities to identify, analyse, and act before it’s too late.
A one-size-fits-all approach to value propositions has never worked. Your company needs to find its niche and be specific about where it fits into its market. By collecting and referencing relevant, historical data points from different buyer personas, you can offer highly-personalised value propositions to each specific customer segment that targets your business in the future. With comprehensive data at our disposal, we can say the right thing to the right customer at exactly the right time.
The eventual winners of this perpetual game we call business will be the ones who can constantly maintain and evolve their pipeline to create a flawless business process. Pipeline data uncovers exactly where leads are getting stuck, where they are failing to engage, and where they are getting completely lost during their buyer journey. Pipeline management software, such as a CRM system, automates pipeline management, and reporting.
Data gives us a concrete insight into the success of marketing campaigns, and which segments are engaging or not. Having this information at our disposal, we can trim the fat from our marketing campaigns, streamline them, fix or halt what’s not working, and redeploy specific content to the correct customer segments. Sales analysis maximizes sales capacity simply by outlining what our limits are. It helps us make better decisions.
While there might be no time constraints on when exactly to conduct a sales analysis, it’s important that company leaders have access to real-time statistics to make data-driven decisions. A successful business works across different departments, floors, and even industries. It’s not efficient to maintain and access different business metrics across different systems; it’s important to have one, centralised dashboard that aggregates each vital report.
Each business has unique data points to follow, but their separate data points can all be collated within the similar dashboards.
Managers need to keep an eye on their team and sales reps need to see their performance compared with the rest of their team. The sales rep and manager Dashboard is a shared dashboard that provides a comprehensive overview of productivity metrics. This is the go-to resource for managers and reps on a daily basis, featuring visualisations for that day’s stats, and how they fit in with collective team goals.
This one does what it says on the tin. The salesleaderboard tells us who is performing best out of the sales team by aggregating typical, selected metrics such as new accounts created, MRR, and customer retention numbers. Above all it is a tool used for motivation, helping to foster healthy competition between hungry sales teams.
The deal performance dashboard breaks down the revenue that is expected to close, how many deals are in the pipeline, and how busy each stage is at any one time. This dashboard gives us a real-time insight into pipeline leakage and bottlenecks.
The sales activity dashboard gives managers detailed knowledge of what their team gets up to on a day-to-day basis. This doesn’t mean stats like how many times Jill visited the vending machine, it details sales driver data, such as how many calls are made, how many emails are sent out, and how many doors are knocked. From this, managers can glean which processes need automation to be more efficient, employee strengths, and where they need to improve.
The win/loss dashboard visualizes the top deals in any given period, the number of closed deals, and the number of lost deals. Above all, this dashboard provides clarity regarding customer perception of a product and experience over the sales process. With this data readily-available to them, sales teams can identify and look into certain actions or activities that caused a deal to be won or lost.
Sifting through heaps of data is like wading through custard: it takes time. Instead of plucking data points and metrics out of thin air, willy-nilly, choose them wisely. Make sure you know which key performance indicators (KPIs) to follow, based on how they suit your company. Finally, it’s crucial to understand which ways you can use them.
Monthly sales growth counts the month-on-month increase or decrease in revenue for your business. This is one of the core metrics that needs to be watched in any industry, because it offers a concrete insight into the overall health of your business.
“What can we afford to do next month?”
Overall, this data point decides whether your business belt needs tightening or loosening in terms of financial outlay. Sales managers use monthly sales growth statistics to track overall effort and results and to find out what they need to change in the sales process. Sales reps use monthly sales growth as a motivation metric.
The sales opportunity metric orders leads based on their opportunity value and how likely they are to close a deal. The success of this metric is rewarded by increased value per prospect, improved win probability for a pipeline stage, and faster individual pipeline stage transition.
“What’s the point in all that outreach if nobody is interested?”
With this metric, sales reps can prioritize communications and nurturing depending on the opportunity they present for the company.
Average conversion time measures the typical amount of time it takes for a prospect to become a paying customer. With this metric, we can gauge the efficiency of our sales funnel and make better judgement on how likely a prospect is to become a customer. Time is money. The quicker you convert, the more conversions you can make.
“Where can we trim the fat from our customer journey?”
Sales executives and sales directors use this KPI to forecast revenue over any period of time. Whereas, sales leaders and sales reps use Average Conversion Time as a productivity and pipeline efficiency indicator.
Lead conversion rate is the amount of people who visit your website and convert to leads. Lead win rate is the amount of those leads who convert to buying customers. Lead conversion rate gives us an insight into a company’s ability to attract the right audience and the efficiency of its website when turning them into leads. Win rate simply goes one step further in telling us how many of those leads became customers.
“Are all of these leads converting to sales?”
Sales executives use win rate to gauge whether their product is a fit for the market, whether the price is right, and whether sales efforts are working or not. Sales reps use conversion Rate to measure how effective their pitches to prospective customers are.
Average revenue per user tracks how much money, on average, each customer is worth to you business. There are a lot of different ways your business can make money, but one of the most obvious, yet neglected ways is by selling more to each customer.
“How much are all these customers actually worth to us?”
By paying consideration to this metric, organisations can maximise their revenue from their existing customer base and make money more easily. Sales directors and sales managers use this metric to optimise their teams’ sales process. Sales reps aim to improve this metric by making more money with less effort.
Customer retention is a straightforward concept: keep hold of your existing customers so they return to you in the future. Customer churn rate tells us the opposite: how many customers end their relationship with a company within a certain time frame. It costs more to acquire new customers than it does to maintain old ones, so you need your customer retention rate to be higher than your churn rates. In a perfect world – way higher.
“Customer retention is becoming more and more important across every industry”
Sales reps can use retention and churn rates to identify customers that are more likely to stick around based on certain data points. Sales executives and sales managers can use retention and churn rates to gauge the success of their customer service activities.
Customer acquisition cost (CAC) counts the costs associated with the acquisition of new customers, both in terms of sales and marketing. The best way to increase revenue is often to decrease costs; spending more than you earn is a surefire road to business failure.
“How much does it cost to get each into and through the pipeline?”
Generally, sales directors use this KPI to create profitable, scalable sales processes and to define the most cost-effective lead sources.
Customer lifetime value (LTV) measures the amount of revenue each customer brings to your company. This data point helps us make important business decisions about marketing, product development, and customer support. It’s used in combination with different metrics to gauge the success of different sales processes.
“The CAC is higher than the LTV…we’re doomed!”
Monthly recurring revenue (MRR) comes from two different sources. New MRR is additional revenue a business adds in a month from new customer acquisition. Expansion MRR is additional, recurring revenue from existing customers who have upgraded their software plans.
“Where’s all our revenue coming from?”
SaaS sales reps need to know where MRR comes from in order to make decisions about which customers to target. SaaS sales directors and executives use MRR to trace their company’s growth and decide which sales activities their teams should pursue.
Sales rep productivity is measured through how many units of whichever particular sales driver they deliver within a certain timeframe. This is things such as calls made, meetings booked, demos given, and doors knocked on. This is a productivity metric, and gives a clear understanding about the amount of effort that goes into a sale.
“Who’s hot and who’s not?”
Sales leaders use this metric on an individual basis to unearth the strengths and weaknesses of their team. Sales reps use this metric as a point of healthy competition and motivation.
Seeing as though you’ve gotten this far, you're probably thinking that you need a sales analysis dashboard to take advantage of all that beautiful data you’ve got hiding in spreadsheets. Maybe you’ve already got one, but nobody really uses it. Having a dashboard is great, but it’s important that it is effective in its job. The following tips will help you and your team get the most out of your sales dashboard.
Connect your dashboard to a live data source and make sure it’s constantly synchronised. This helps minimise manual data input and eliminate mistakes. Furthermore, timely, up-to-date data is essential to making the right decisions at the right time. By all means, you should use yearly, quarterly, monthly, and weekly data for periodic analysis of your business, but live data streams can help you to make some huge decisions for your business.
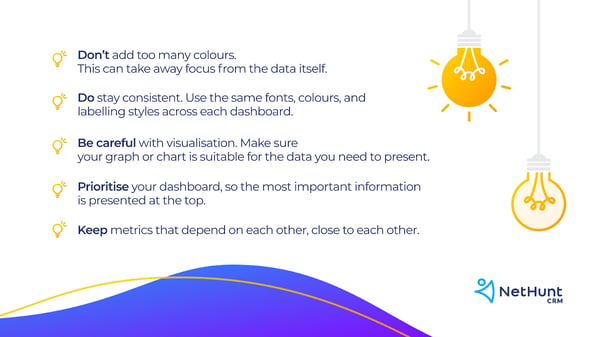
The whole point in creating a sales dashboard is to visualise complex data sets in a clear and comprehensible way. The following tips will help you do that.
Getting your team together and taking their input in the creation of dashboards actually helps them better understand, get used to, and immerse them in a dashboard from its creating.
When using multiple dashboards for different teams, you need to ensure that reps, managers, and executives can bounce between them quickly. Whilst it’s normal to create different dashboards for different levels of employees, shared access to dashboards can be a good thing.
Sharing dashboards across teams creates a new level of transparency, aiding a healthy, competitive atmosphere in the office. It empowers sales teams to achieve higher numbers and helps other employees visualise their impact on your company. At the same time, team leaders, managers, and directors can use each data point they see to streamline and effectuate businesses.
Sales analytics are key to quantifying the effects of different marketing and sales actions your company makes. They are an invaluable resource as your company constantly strives for perfection, efficiency, and revenue. There’s an ocean of data out there to make your business better. Dive in.


If you could squeeze a little more effort out of your sales team...would you?
 by Haley Smith

When it comes to data, if you can’t measure it, you can’t improve upon it.
 by Ashleigh Popera